Indicator
Description: Customer surveys should be utilized to evaluate the customer service being provided to land development applicants and their consultants.
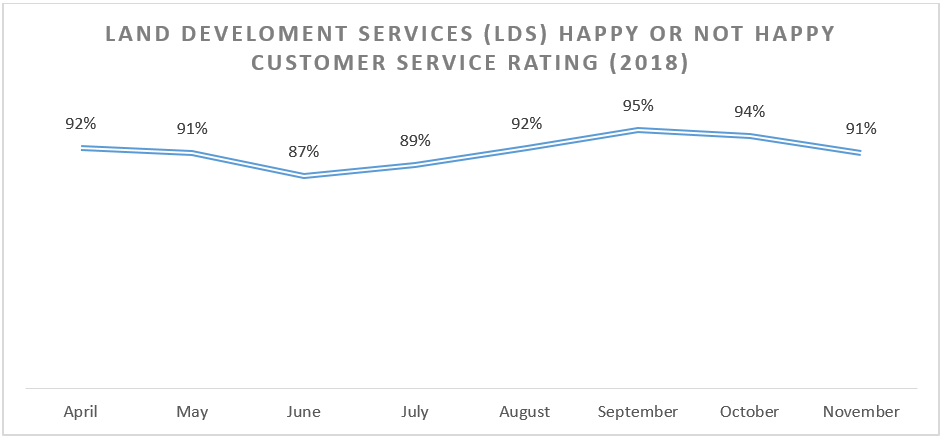
Performance Measure: Percent of Land Development Services Customers Rating Their Experience as “Happy” – the percentage of respondents who rated their customer experience as “happy”
Data: See graph below.
Interpretation: In April 2018, Land Development Services (LDS) launched a customer service rating program called “Happy or Not”. Each stand-alone kiosk displays a single question and four button option showing different levels of satisfaction or happiness (green), satisfied (light green), unsatisfied (pink), and unhappy (red). While LDS does not presently use the results to evaluate individual performance, the data, specifically looking at the responses for specific times of day and days of the week, has allowed for adjustments in procedures to provide better customer service. The percentages shown in the line graph above correspond to the percentage for the highest “Happy” rating. Through November 2018, there have been a total of 5,839 responses for an average of 730 responses a month. The ratings range from a low index of 87 to a high of 97 with an average of over 94 on the Happy Index.
Source:Fairfax County Land Development Process