

Fairfax County uses electricity and natural gas throughout its operations. Much of that energy use allows the county to heat and cool its facilities and power the lights and equipment in them. Some of the county’s energy use helps ensure adequate night-time lighting on streets and ball fields. Other energy uses are less visible but just as essential, such as wastewater pumping and treatment.
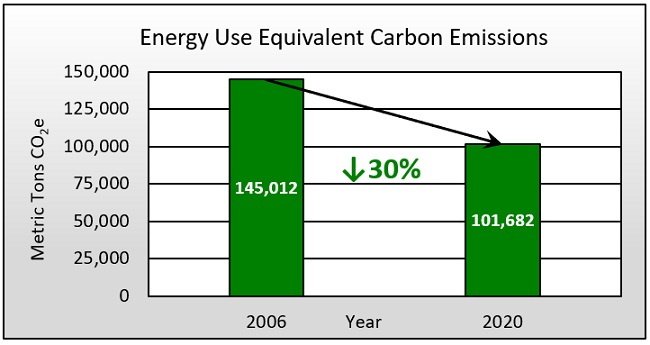
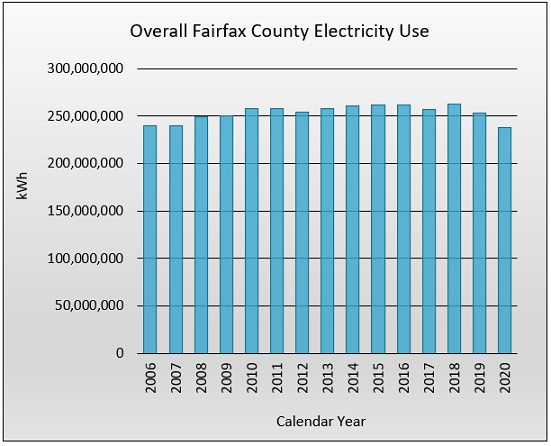
The graph above shows the equivalent carbon emissions from electricity and natural gas used at county facilities in 2006 and 2020. Annual energy consumption from 2006 through 2020 is provided in more detail below, with electricity in blues and greens and natural gas in reds and yellows.
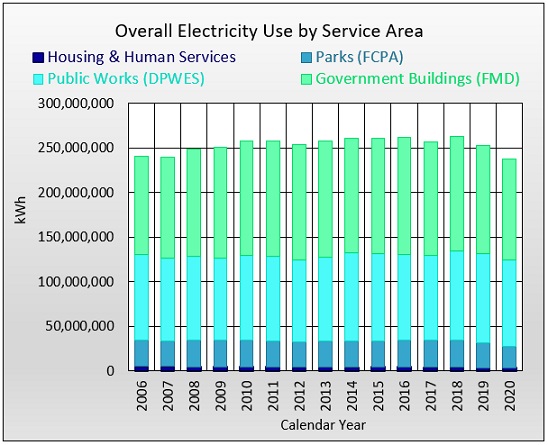
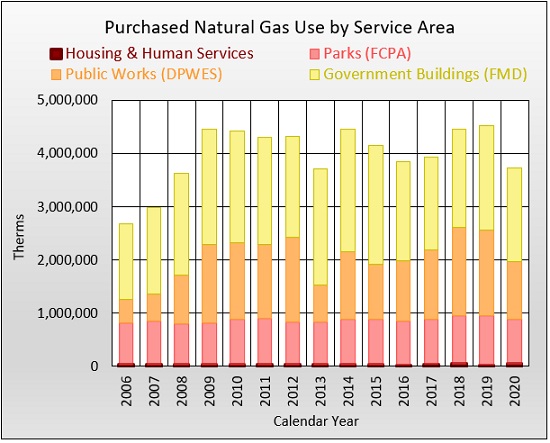
The bottom two graphs break down the usage into four service areas – Housing & Human Services, Parks, Public Works, and County Government Buildings. Refer to the Service Area Homepage for more information on a specific service area’s usage.
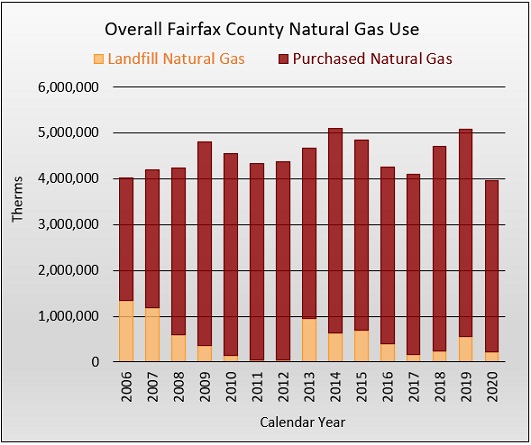
The natural gas use graph above shows both purchased gas and landfill gas produced by the county’s two closed sanitary landfills. Each bar in this graph is cumulative, showing the total units of heat (therms) from both gas sources used by the county in that year. The county uses landfill gas as an alternative to natural gas purchased from external vendors whenever possible. Note that the rest of the natural gas use graphs included in these energy data pages do not show landfill gas usage.
*Approximately 10% of the landfill gas data was estimated from 2008-2009 based on usage from other years.*