Pedestrian Safety Isn’t Just a Transportation Problem. It’s a public health challenge impacting some people more than others in Fairfax County.
Traffic Crashes and Fatalities by Travel Mode
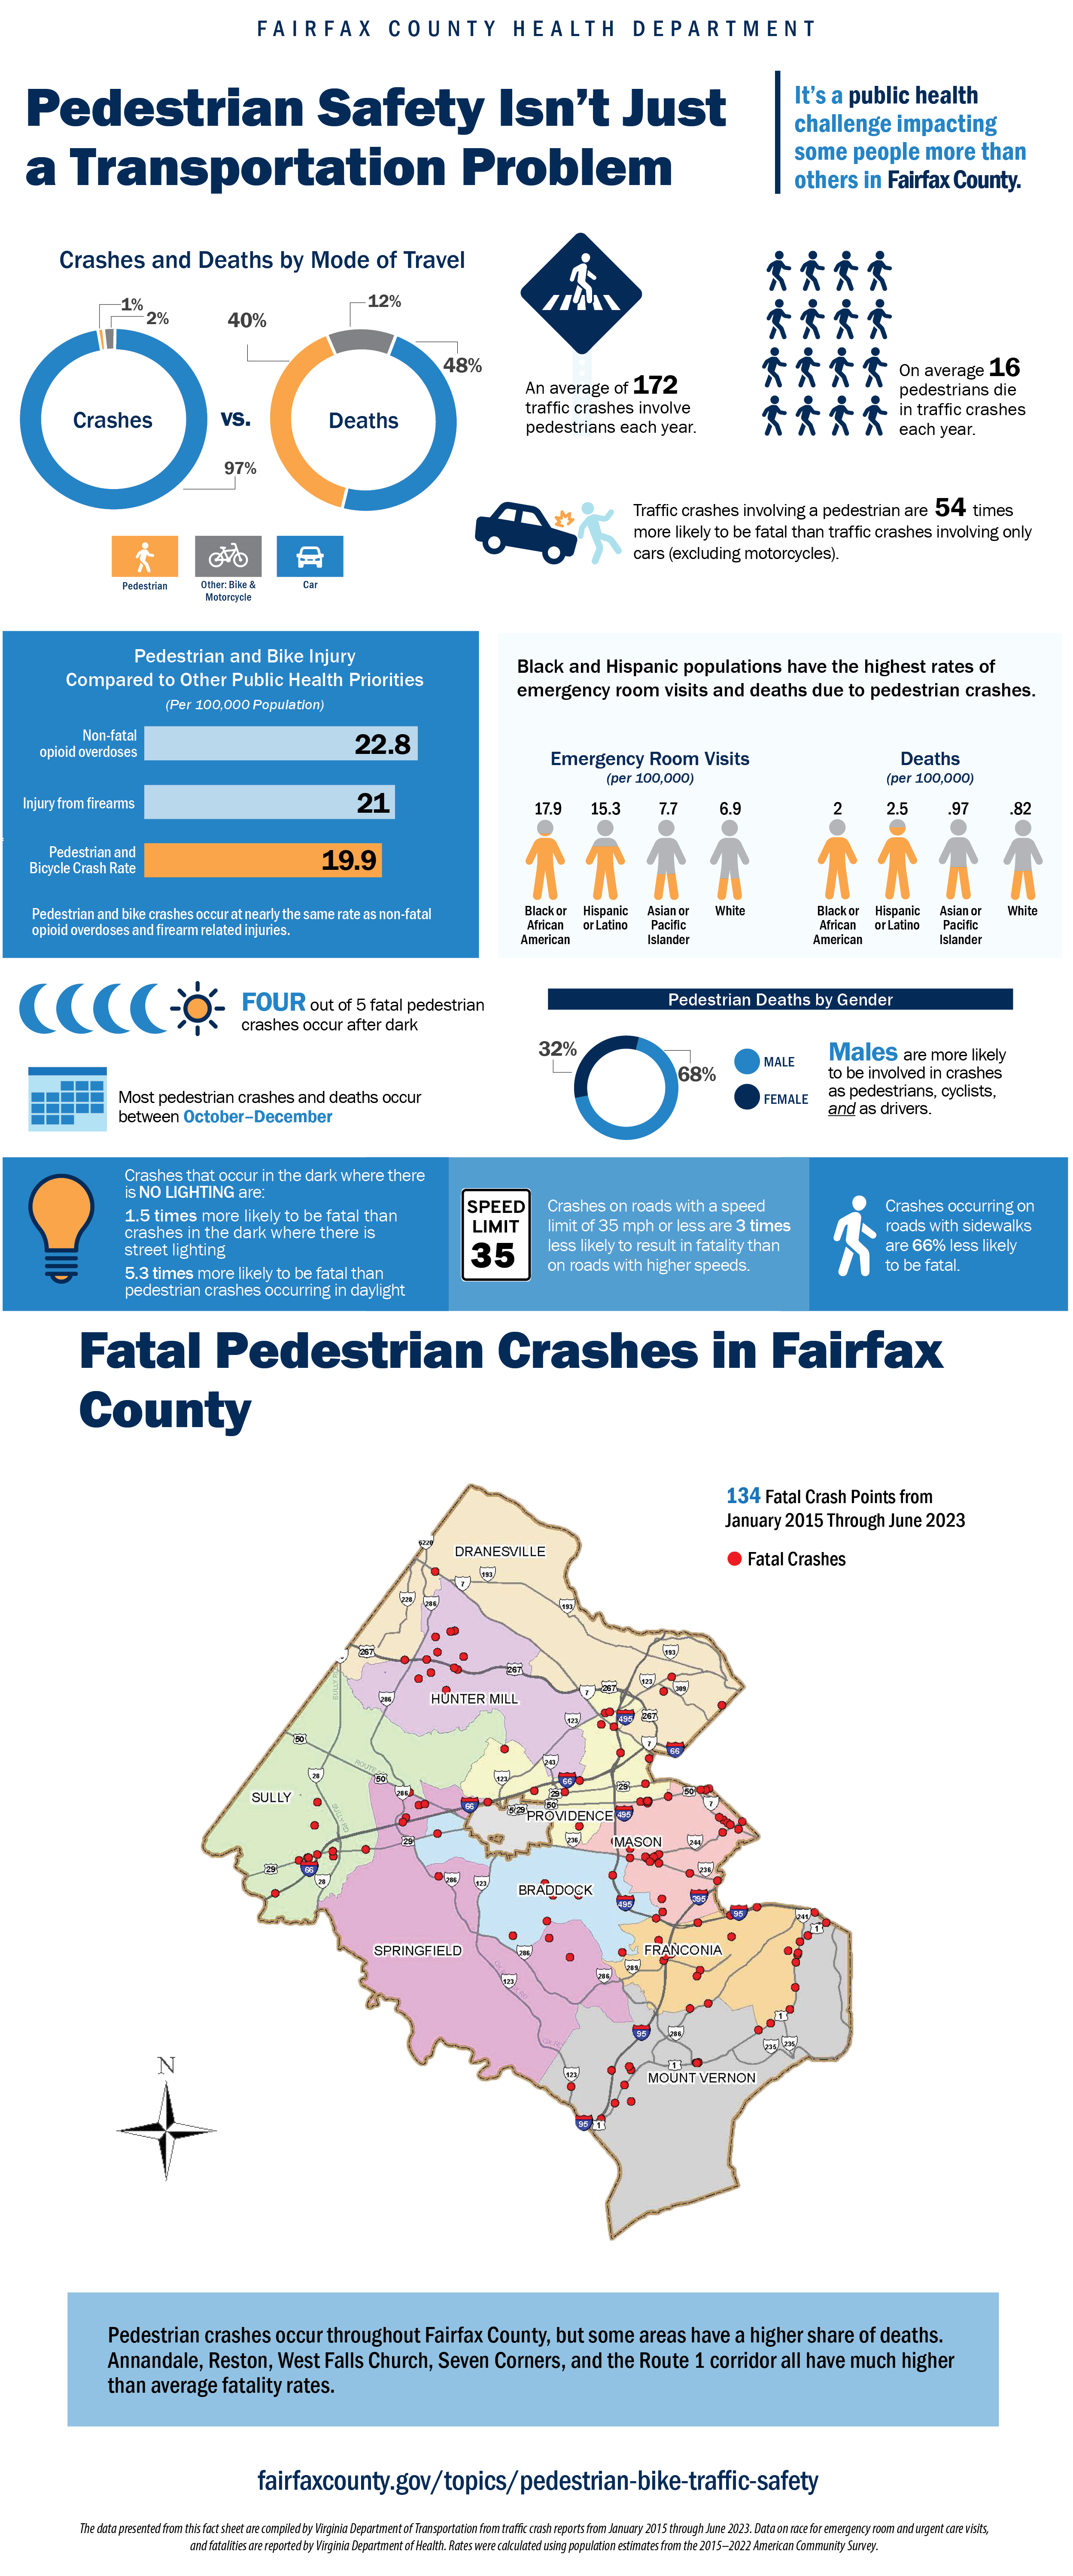
- Two donut charts comparing crashes and deaths by mode of travel. The first donut chart, labeled “Crashes”, shows “97%” for “Cars” segment, “2%” for “Other: Bike & Motorcycle” segment, and “1%” for “Pedestrian” segment. The second donut chart, “Fatalities”, shows “48%” for “Car” segment, “12%” for “Other: Bike & Motorcycle” segment, and “40%” for “Pedestrian” segment. 3 rectangles colored respective to their segments in the donut plots, from left to right, one with a walking stick figure icon with the text label “Pedestrian”, one with a bicycle icon with text label “Other: Bike & Motorcycle”, and one with a car icon with text label “Car”.
- [Pedestrian crossing sign icon] An average of 172 traffic crashes involve pedestrians each year.
- [16 walking stick figure icons] On average 16 pedestrians die in traffic crashes each year
- [Icon of car hitting pedestrian] Traffic Crashes involving a pedestrian are 54 times more likely to be fatal than traffic crashes involving only cars (excluding motorcycles).
Pedestrian and Bike Injury Compared to Other Public Health Priorities (Rates per 100,000 Population)
- Bar graph showing pedestrian and bike injury compared to other public health priorities, per 100,000 population. Non-fatal opioid overdoses: 22.8; Injury from firearms: 21; Pedestrian and bicycle crash rate: 19.9. Pedestrian and bicycle crash rate highlighted in orange compared to the other bars in light blue.
- Pedestrian and bike crashes occur at nearly the same rate as non-fatal opioid overdoses and firearm related injuries.
Black and Hispanic populations have the highest rates of emergency room visits and fatalities due to pedestrian crashes.
- Emergency Room Visits (per 100,000 population) [4 stick people shaded respective to the rate in orange and grey]
- Black or African American: 17.9
- Hispanic or Latino: 15.3
- Asian or Pacific Islander: 7.7
- White: 6.9
- Deaths (per 100,000 population) [4 stick people shaded respective to the rate in orange and grey]
- Black or African American: 2.0
- Hispanic or Latino: 2.5
- Asian or Pacific Islander: 0.97
- White: 0.82
Pedestrian Fatalities by Gender
- [Donut chart with one section shaded light blue with text label “68%” representing males and one section shaded dark blue with text label “32%” representing females]
- Males are more likely to be involved in crashes as pedestrians, cyclists, and as drivers.
[Four blue moon icons and one sun icon] Four out of 5 fatal pedestrian crashes occur after dark
[Four blue moon icons and one sun icon] Four out of 5 fatal pedestrian crashes occur after dark.
[Calendar icon] Most pedestrian crashes and deaths occur between October – December.
[Light bulb icon] Crashes that occur in the dark where there is NO LIGHTING are: 1.5 times as fatal as crashes in the dark where there is street lighting 5.3 times as fatal as pedestrian crashes occurring in daylight
[Road sign icon with text “Speed Limit 35”] Crashes on roads with a speed limit of 35 mph or less are 3 times less likely to result in fatality than on roads with higher speeds.
[Walking stick figure icon] Crashes occurring on roads with sidewalks are 66% less likely to be fatal.
Pedestrian Fatal Crash Rates by Census Tract in Fairfax County
- [Map of Fairfax County with districts shaded and dots indicating fatal crashes.] 134 Fatal Crash Points from January 2015 Through June 2023.
- Pedestrian crashes occur throughout Fairfax County, but some areas have a higher share of deaths. Annandale, Reston, West Falls Church, Seven Corners, and the Route 1 corridor all have much higher than average fatality rates.
fairfaxcounty.gov/topics/pedestrian-bike-traffic-safety
The data presented from this fact sheet are compiled by Virginia Department of Transportation from traffic crash reports from January 2015 through June 2023. Data on race for emergency room and urgent care visits, and fatalities are reported by Virginia Department of Health. Rates were calculated using population estimates from the 2015–2022 American Community Survey.