


Fairfax County Government consumed less energy for operations and produced fewer greenhouse gas emissions in fiscal year 2023 than it has in any year since it started tracking data – a significant indicator in the county’s efforts to become carbon neutral by 2040.
We're working to make operations greener such as switching to electricity to power buildings – including from renewable sources like the sun – and using less water and energy overall. Data from our County Energy Dashboard shows those efforts are making a difference in shrinking our carbon footprint and reducing utility costs.
“The investments we are making in our facilities to reduce energy use and employ renewable energy are necessary to meet the environmental goals of the Countywide Strategic Plan and our operational goal of carbon neutrality,” said County Executive Bryan Hill. “As this progress demonstrates, it’s important that we keep moving forward toward a healthier, sustainable future for Fairfax County.”
Data Highlights
A few highlights from FY 2023:
- Overall greenhouse gas emissions from energy use – including from electricity, natural gas and vehicle fuel - is down more than 25% compared to the baseline in FY 2018, due to the combination of energy efficiency measures and a cleaner supply of electricity. County operations still represent less than 5 percent of total greenhouse gas emissions in the Fairfax community with emissions from commercial buildings, homes and vehicles accounting for over 95% of the total.
- Overall building energy use is down more than 16% from the baseline year of FY 2018, and more than 8% below the prior fiscal year as a result of energy efficiency and conservation measures and the robust telework policies implemented in the pandemic.
- Total electricity use is down 7% from the prior fiscal year, driven in large part by the conversion of streetlights to LEDs, and energy-related equipment upgrades at the Norman M. Cole Jr. Pollution Control Plant.
- Total natural gas use is down 12%from the prior fiscal year, partly the result of award-winning energy projects at Cub Run and South Run rec centers that were completed in 2022. A milder winter also impacted heating costs.
- The avoided costs from energy reductions at county facilities are estimated to be $5 million per year. The term ‘avoided costs’ is used because utility rates have increased since the baseline period of FY 2018.
New data from the county’s energy performance contract shows that energy projects at Cub Run and South Run Rec Centers and the City of Fairfax Library have resulted in annual avoided utility costs in excess of $471,000. The projects achieved significant energy savings, as expected, and rising utility rates further increased the value of the work.
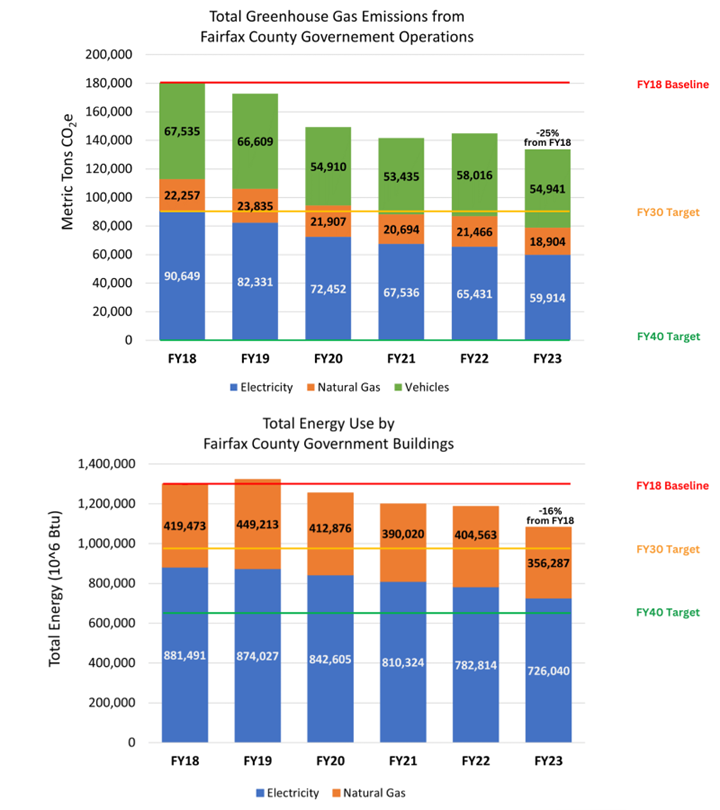
Chart 1: Total Greenhouse Gas Emissions from Fairfax County Government Operations
FY18 Metric Tons: 90,649 from Electricity + 67,535 from Vehicles + 22,257 from Natural Gas
FY19 Metric Tons: 82,331 from Electricity + 66,609 from Vehicles + 23,835 from Natural Gas
FY20 Metric Tons: 72,452 from Electricity + 54,910 from Vehicles + 21,907 from Natural Gas
FY21 Metric Tons: 67,536 from Electricity + 53,435 from Vehicles + 20,694 from Natural Gas
FY22 Metric Tons: 65,431 from Electricity + 58,016 from Vehicles + 21,466 from Natural Gas
FY23 Metric Tons: 59,914 from Electricity + 54,941 from Vehicles + 18,904 from Natural Gas
(25% decrease from FY18)
Chart 2: Total Energy Use by Fairfax County Government Buildings
FY18: 881,491 Electricity Btu + 419,473 Natural Gas Btu
FY19: 874,027 Electricity Btu + 449,213 Natural Gas Btu
FY20: 842,605 Electricity Btu + 412,876 Natural Gas Btu
FY21: 810,324 Electricity Btu + 390,020 Natural Gas Btu
FY22: 782,814 Electricity Btu + 404,563 Natural Gas Btu
FY23: 726,040 Electricity Btu + 356,287 Natural Gas Btu
(16% decrease from FY18)
The county energy dashboard includes overall energy use, cost, and emissions data for its more than 500 buildings and facilities, including structures like streetlights, wastewater treatment, pumping stations and radio towers. The data is live – it is pulled directly from the county’s energy data management software – and presented in fiscal years, consistent with the climate and energy targets in our Operational Energy Strategy.
The strategy includes a goal of being energy carbon neutral by 2040, with 50 percent of county electricity coming from renewable sources. In calendar year 2023, five buildings were outfitted with rooftop solar panels and 2 buildings received whole-building energy retrofits. A total of 44 county buildings are now Leadership in Energy and Environmental Design (LEED®)- certified. Solar projects are planned at 13 more facilities in 2024. Five projects under the energy performance contract are slated to be completed in 2024, with an additional 18 projects in the pipeline.
To learn more about the county’s climate action goals, policies and programs, visit the Office of Environmental and Energy Coordination.
.