


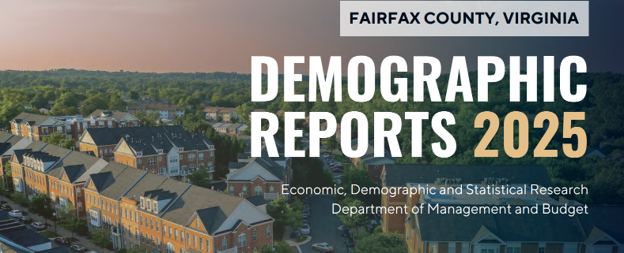
Fairfax County’s population and housing inventory continued to grow during 2024, while median home values climbed over 6% between January 2024 and January 2025, according to the newly released Demographic Reports 2025.
The annual report provides a snapshot of Fairfax County as of Jan. 1, 2025, with estimates and forecasts on population, households and housing units, along with data on home values and development activity. Information is broken down by geographic areas such as supervisory districts, towns, zip codes and census tracts.
"These demographic reports provide the localized data necessary to shape policies, plan intelligently and support the evolving needs of Fairfax County’s residents and businesses," says Phil Hagan, director of the Department of Management and Budget.
Residents and county agencies can explore detailed demographic information reported in Demographic Reports using interactive visualizations available on the county’s Demographics site, including the Fairfax County Overview, Community Profiles and Demographic Mapper. More recent economic trends since Jan. 1, 2025, are not captured in this edition but will be addressed in future demographic reports as data becomes available.
Key Highlights from the 2025 Report
Population, Housing Inventory and Home Values: Between January 2024 and January 2025, Fairfax County’s housing inventory increased by 0.3% to 438,664, the population increased by 0.3% to 1,199,660, and the median market value of owned housing increased by 6.2% to $752,378.
Household Income: According to the Census Bureau’s 2024 American Community Survey (ACS) 1-Year estimates, Fairfax County’s Median Household Income was $154,545, an increase of 9.2% from 2023, following a temporary 2.5% decline that year. Fairfax County’s median household income was nearly double the national median ($81,604) and was over 1.5 times the state median ($92,090) during the same timeframe.
Gini (Equality) Index: Since 2024, Demographic Reports has introduced the Gini index (0 = perfect equality; 1 = perfect inequality) to track income inequality. According to the Census Bureau's 2024 ACS 1-Year estimates, Fairfax County’s Gini index declined slightly from 0.43 to 0.42, indicating lower inequality than last year, and remains lower than the DMV region (0.45), Virginia (0.47), and the U.S. overall (0.48). Over the past decade, income inequality has increased for the DMV region but has remained relatively stable in Fairfax County.
View the Report Online
The information in the demographic reports can be viewed on the Demographic Interactive Mapper, a tool that lets users select data by 15 geographies, such as census block groups, communities and zipcode geographies.
The Demographic Reports 2025, the Demographic Interactive Mapper and other demographic resources are available on our website.
 SIGN UP FOR DAILY EMAIL HEADLINES