


The 2022 Demographics Report is now available online. The report takes a deep dive into data about our area including population, household and housing unit estimates.
Discover top trends from the report:
HOUSING GROWTH CONTINUES
Fairfax County saw a 0.2% annual change from 2021 to 2022, with more than 800 new units of housing being added across all types. In the past five years (2017-2022), the county added 1,203 single family, 2,827 townhouses and 6,694 multi-family housing units, representing an annual growth rate of 0.1% for single family, 0.6% for townhouses and 1.1% for multi-family units.
While there have been fluctuations over the years, the general trend is clear: the county continues to see steady housing growth, particularly in multi-family units and townhomes.
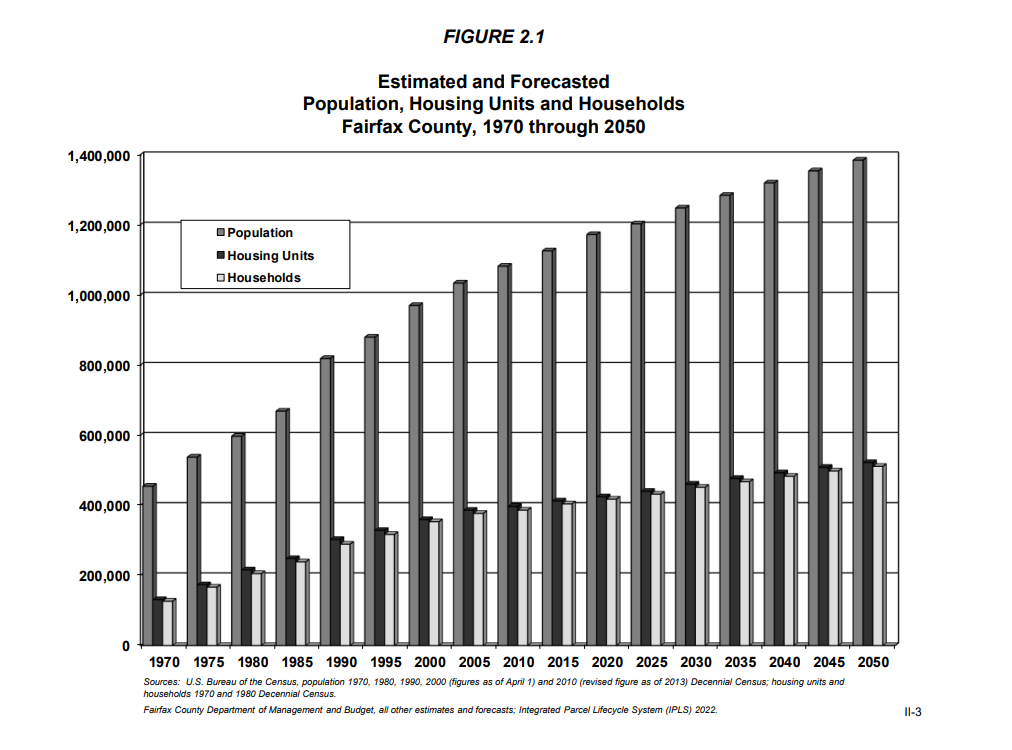
POPULATION GROWTH MAY BE SLOWING DOWN
Population growth has slowed down in the county since 2020. In fact, in 2021 the total population decreased, resulting in the first negative growth recorded in Fairfax County since 1840.
The Census Bureau Vintage 2021 Population estimates indicate that all factors – largely reduced international in-migration, declined natural growth and increased domestic out-migration – contributed to the slowing of population growth. The 2022 Demographic Report shows that our population growth saw a mild recovery (the total population in 2022 was estimated to be 1,172,646, a 0.2% annual growth), it remains to be seen whether the slowed growth is temporary due to the pandemic.
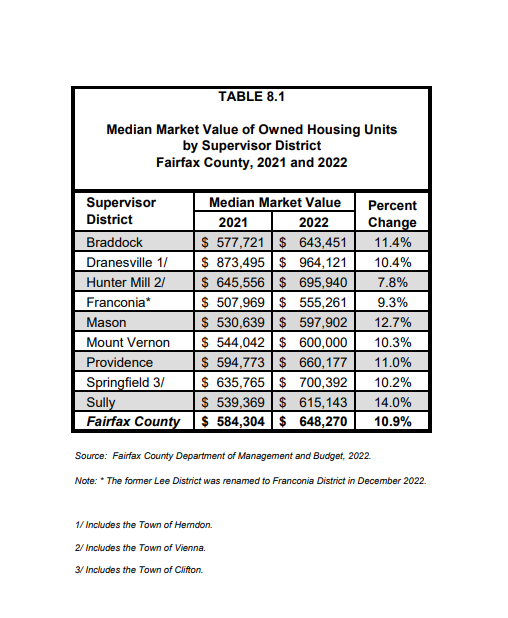
MARKET VALUE OF HOUSING UNITS ARE UP
In 2022, the county’s median market value of owned housing units was $648,270, a 10.9% increase from 2021. Among Supervisor Districts, the highest increase was in the Sully District (up 14%), and the lowest was in the Hunter Mill District (up 7.8%). The average monthly rent increased from $1,787 in 2020 to $1,913 in 2021, based on the latest 2021 Rental Housing Complex Analysis report.
HOUSEHOLD INCOMES INCREASE BUT POVERTY STILL EXISTS
According to the Census Bureau, 2021 American Community Survey 1-Year estimates, Fairfax County’s Median Household Income was $134,115, a 4.5% increase from two years ago, 2019 (note: 2020 estimates are not available due to COVID-19 resulting in nonresponse bias).
Fairfax County’s median household income in 2021 almost doubled the national amount ($69,717), representing more than 1.5 times the state media ($80,963).
However, this is not the case for all families. The Census Bureau 2021 1-Year ACS also reports that 7.1% of persons (more than 80,000 individuals) have an income below the poverty line. Persons in poverty include 10% of children and 6% of seniors (65 and over). The overall poverty rate (7.1%) increased from two years ago (6.0% in 2019).
MORE DEMOGRAPHICS TO EXPLORE
The Economic, Demographic and Statistical Research (EDSR) unit of the county’s Department of Management and Budget conducts quantitative research to support the goals and initiatives of Fairfax County. The team produces small-area economic and demographic estimates and forecasts for the county on an annual basis, as well as conducting special studies and research. This data is then used for program planning, policy initiatives, revenue forecasting, budgeting and more. To learn more and to see additional reports available from the EDSR, visit the Demographics webpage.