


The Mobility & Transportation data dashboard is now available as part of the Countywide Strategic Plan to present information about four key indicators in our community:
- Efficient and Varied Transportation Options
- Infrastructure Condition, Sustainability and Environmental Impact
- Traveler Safety
- Increased Accessibility, Affordability and Equity
DASHBOARD DATA HIGHLIGHTS
1.) Commuters Who Drove Alone to Work Increased, While Working from Home Decreased
In 2022, around 445,000 residents commuted to work (72.1%) and around 172,000 residents worked from home (27.9%). Fewer residents worked from home in 2022 (27.9%) than in 2021 (37.2%), however, the number is still a substantial increase from before the pandemic. Of those that commuted in 2022, approximately 9 in 10 residents drove to work (8 in 10 drove alone and 1 in 10 carpooled).
2.) The Number of Traffic-Related Fatalities Has Increased
In 2022, there were a total of 2,923 crashes of all types, including 60 fatal crashes. This total includes an increase in the number of fatal crashes by 43% since 2019. Crashes of all types decreased by 17% from 2019 to 2022.Despite this overall decline, the number of total crashes has increased significantly by 31% between 2020 to 2022, most likely due to an initial decline in commuting and automobile travel in 2020 brought on by the pandemic. A map of all traffic crashes by type, severity and year is included in the dashboard.
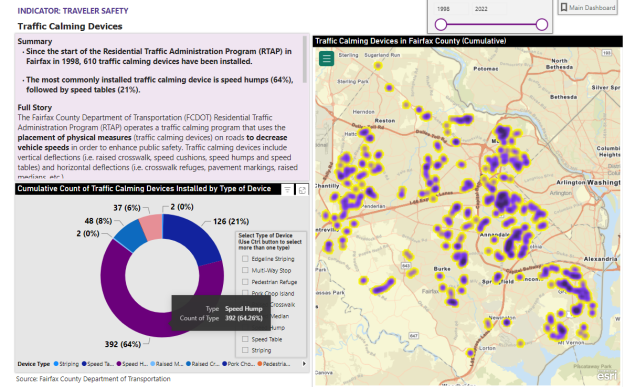
3.) Total of 610 Traffic Calming Devices Installed
Since the start of the Residential Traffic Administration Program (RTAP) in 1998, a total of 610 traffic calming devices have been installed. The most common traffic calming devices installed included 392 speed humps (64%) and 126 speed tables (21%). A map of all traffic calming devices by year is included in the dashboard.
MOBILITY AND TRANSPORTATION DASHBOARD GOALS

These four indicators contain six headline metrics related to commuting patterns, sidewalks and trails, road lane conditions, traffic crashes, traffic calming devices and transit subsidies.
The dashboard is designed to:
- Inform residents and stakeholders
- Monitor progress over time
- Identify any demographic or geographic disparities among residents
- Guide community leaders, practitioners, and advocates in making data-driven decisions.
Overall, the metrics included in the dashboard help to evaluate the goals of reducing the reliance on single-occupancy vehicles and making the county more walkable to improve residents' physical health and reduce traffic-related accidents.
FUTURE UPDATES
The Mobility & Transportation dashboard will be updated yearly to continue monitoring community progress toward a more efficient, affordable, accessible and safe transportation system within Fairfax County.
To review all six Mobility and Transportation Headline Metrics and learn more about all ten Community Outcome Areas, including Economic Opportunity and Healthy Communities, visit the Fairfax Countywide Strategic Plan. For instructions on how to navigate and use the dashboards, please visit the Strategic Plan Dashboard Tutorial.
For questions about the dashboard, contact Countywide Data Analytics at DMBDataAnalytics@fairfaxcounty.gov.