Indicator
Description: It is important to consider the employment prospects for workers across different demographic groups. Ideally, equity should exist across different populations with respect to reasonable wages, opportunities, and job stability. This metric aims to monitor the percent of the population that is employed full time and whose education attainment is at the minimum a bachelor’s degree level. Ideally there would not be any significant difference among races.
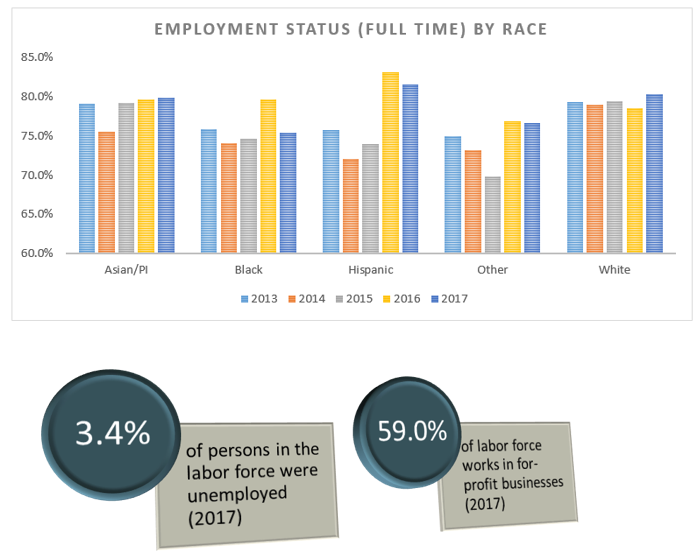
Performance Measure(s): Employment Status (Full Time) by Race – measures the percent of residents by race (Asian/Pacific Islander, Black, Hispanic, White, and Other) who are employed full time.
Data: Infographic – Employment Status
Interpretation: Employment status by race remained relatively consistent from 2013 to 2017, but there are notable differences among the groups.
Source: U.S. Census Bureau, One-Year American Community Survey, PUMS Files, 2013 to 2017
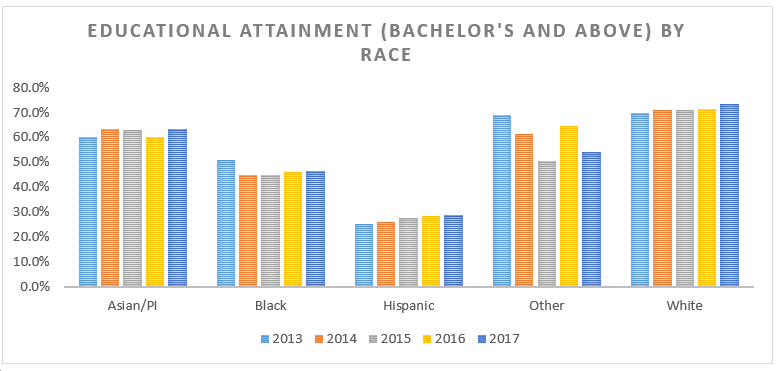
Performance Measure(s): Educational Attainment by Race – measures the percent of residents by race (Asian/Pacific Islander, Black, Hispanic, White, and Other) whose educational attainment is a bachelor’s degree or above.
Data: Infographic – Educational Attainment
Interpretation: From the previous year (2016), the percentage of Asians that possess a bachelor’s degree and above increased by 3.3% while other races decreased by approximately 11%. All other races remained relatively the same.
Source: U.S. Census Bureau, One-Year American Community Survey, PUMS Files, 2013 to 2017


