Indicator
Description: Assessing the basic cost of living is essential for understanding the circumstances under which people live. To do so effectively, it is important to look at the two largest expenses for most families - housing and transportation. Breaking it down by demographic characteristics will facilitate an understanding of how these cost burdens compare across the economic spectrum. It will help identify segments of the population struggling to make ends meet from those making a lifestyle choice.
Performance Measure: Average Percent of Income Dedicated to Housing and Transportation Costs – the Housing and Transportation Index (H+T Index) combines housing and transportation costs and sets the benchmark at no more than 45% of household income.
Data:
- Housing and Transportation Fact Sheet: Fairfax County, Virginia
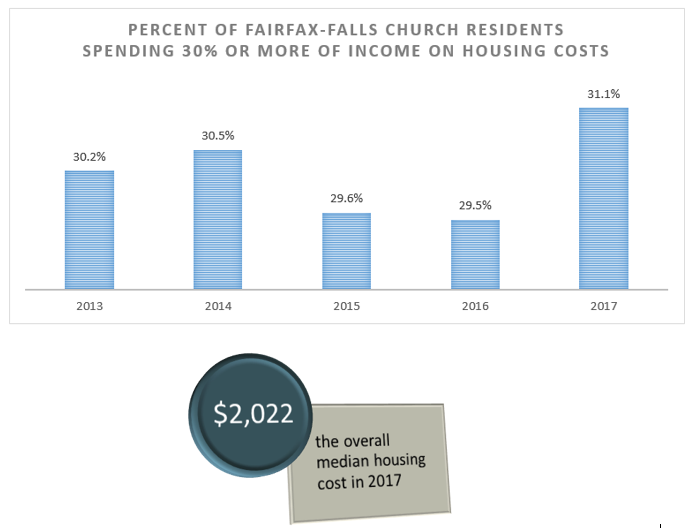
- Infographic – Housing Costs, Fairfax, Falls Church Area
Interpretation: The average percent of income dedicated to housing and transportation is 45%. 31% is dedicated to housing costs, while 14% is dedicated to transportation costs. According to the American Community Survey PUMS data (see infographic), approximately 30 percent of households spent 30 percent or more of their income on housing in each of the following years: 2013 to 2017.
Source: H+T Affordability Index and the U.S. Census Bureau, One-Year American Community Survey, PUMS Files, 2013 to 2017