

Post written by Melanie Malsch, Community Specialist, OEEC
Summer 2024 has delivered sweltering temperatures, a stagnant heat dome, and a series of heat advisories, and we’re not even halfway through. In the 43 days since the official start of summer, there have been 15 days with temperatures at or above 95ºF in Fairfax County, according to data from the National Weather Service. 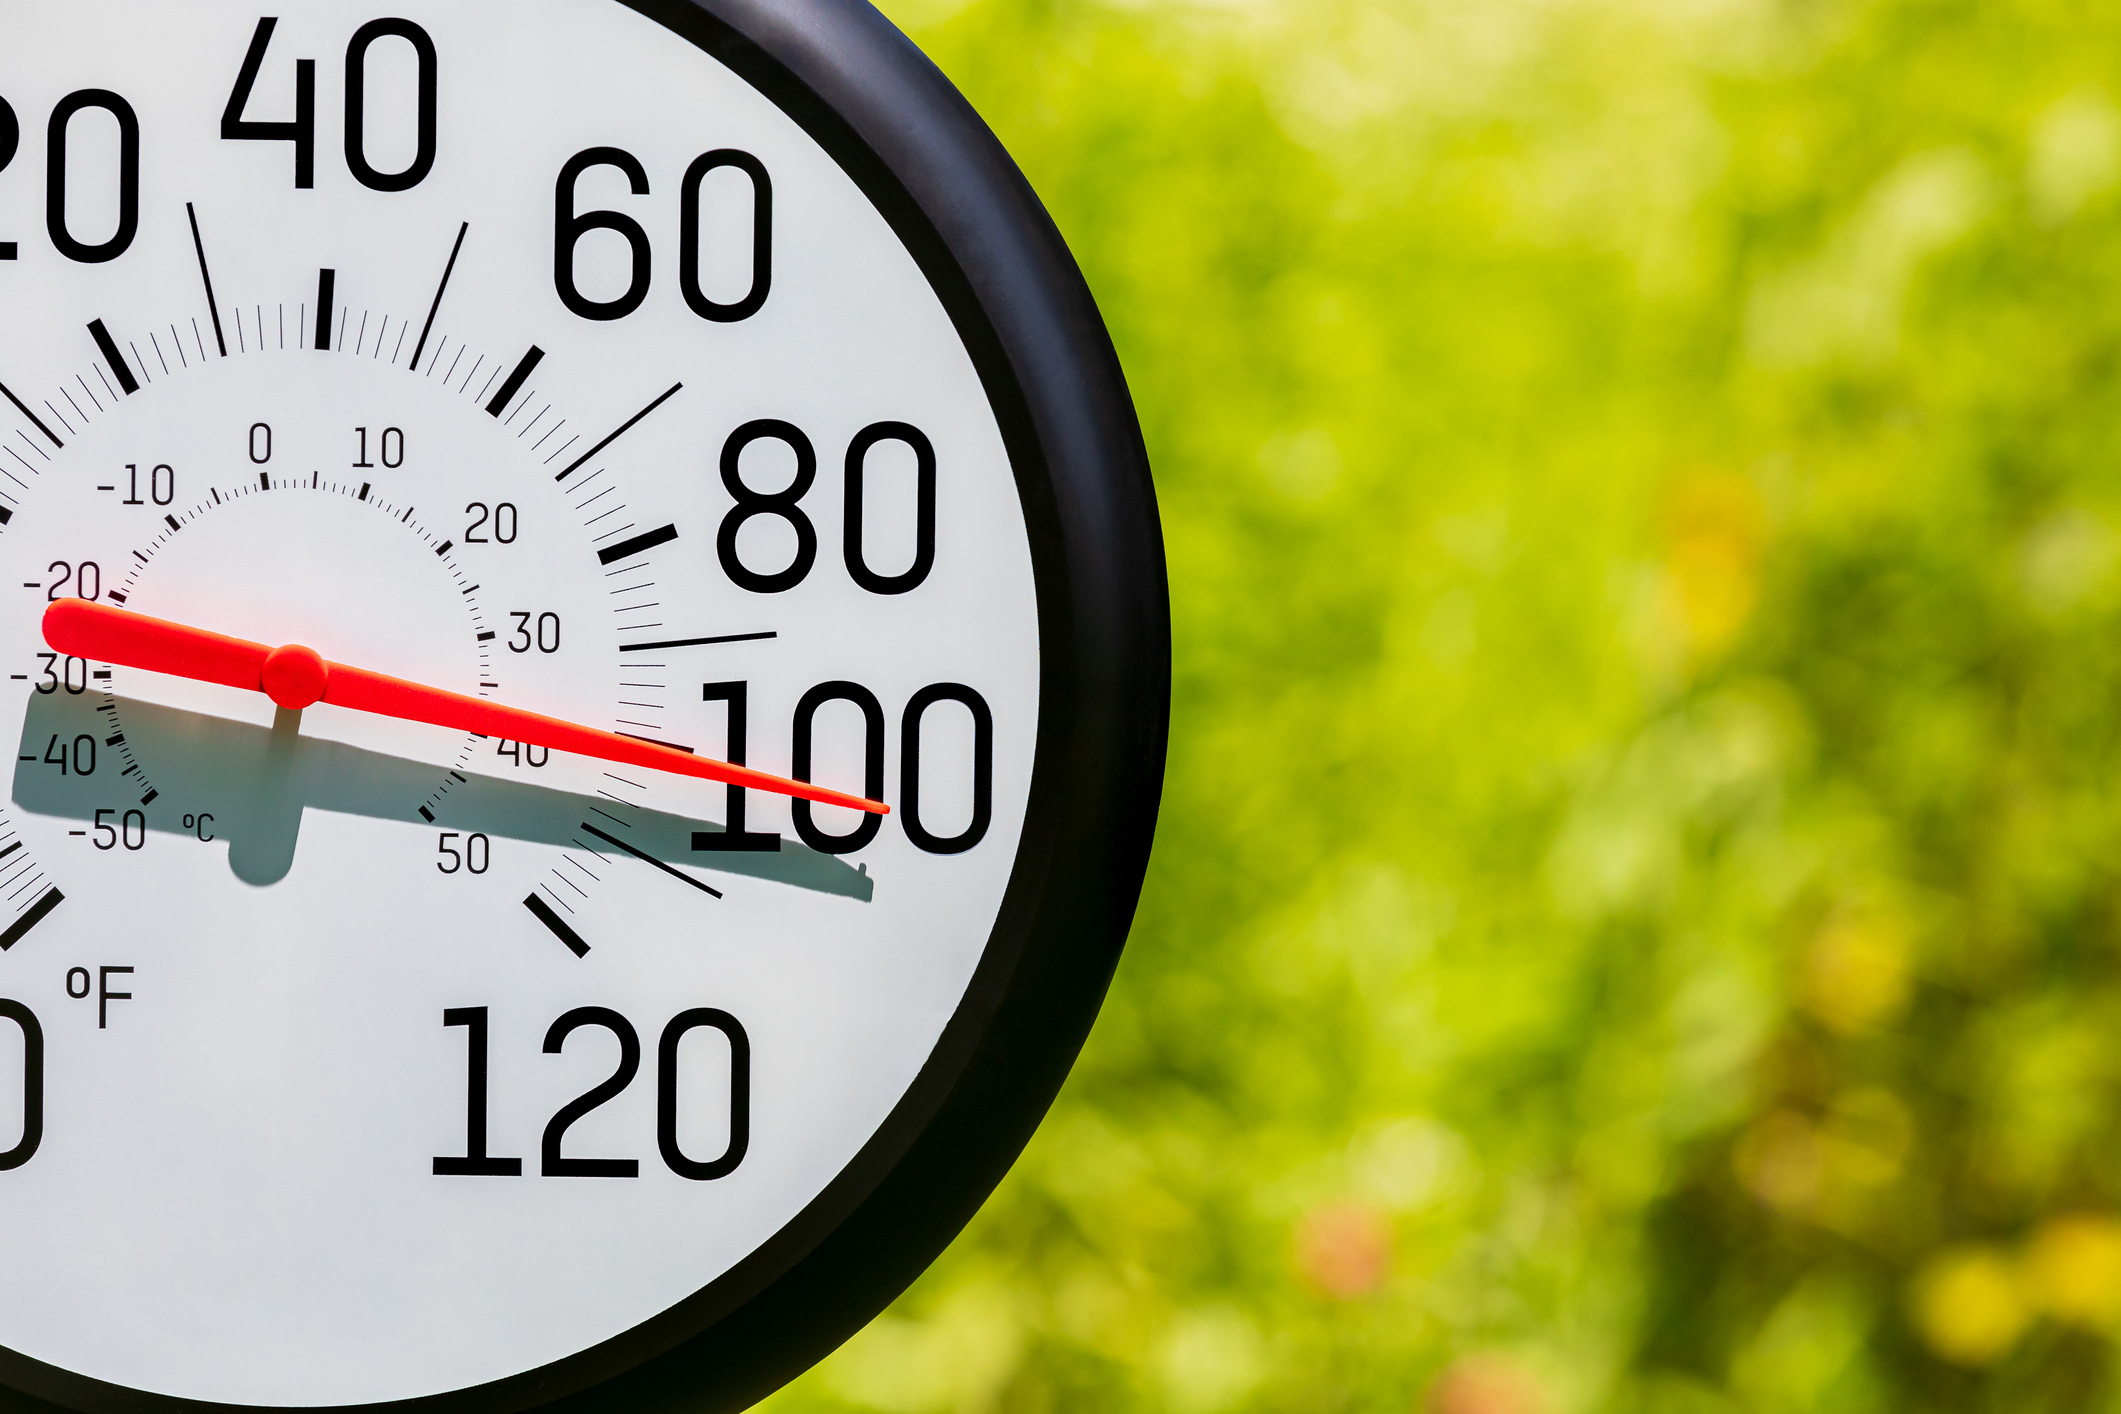
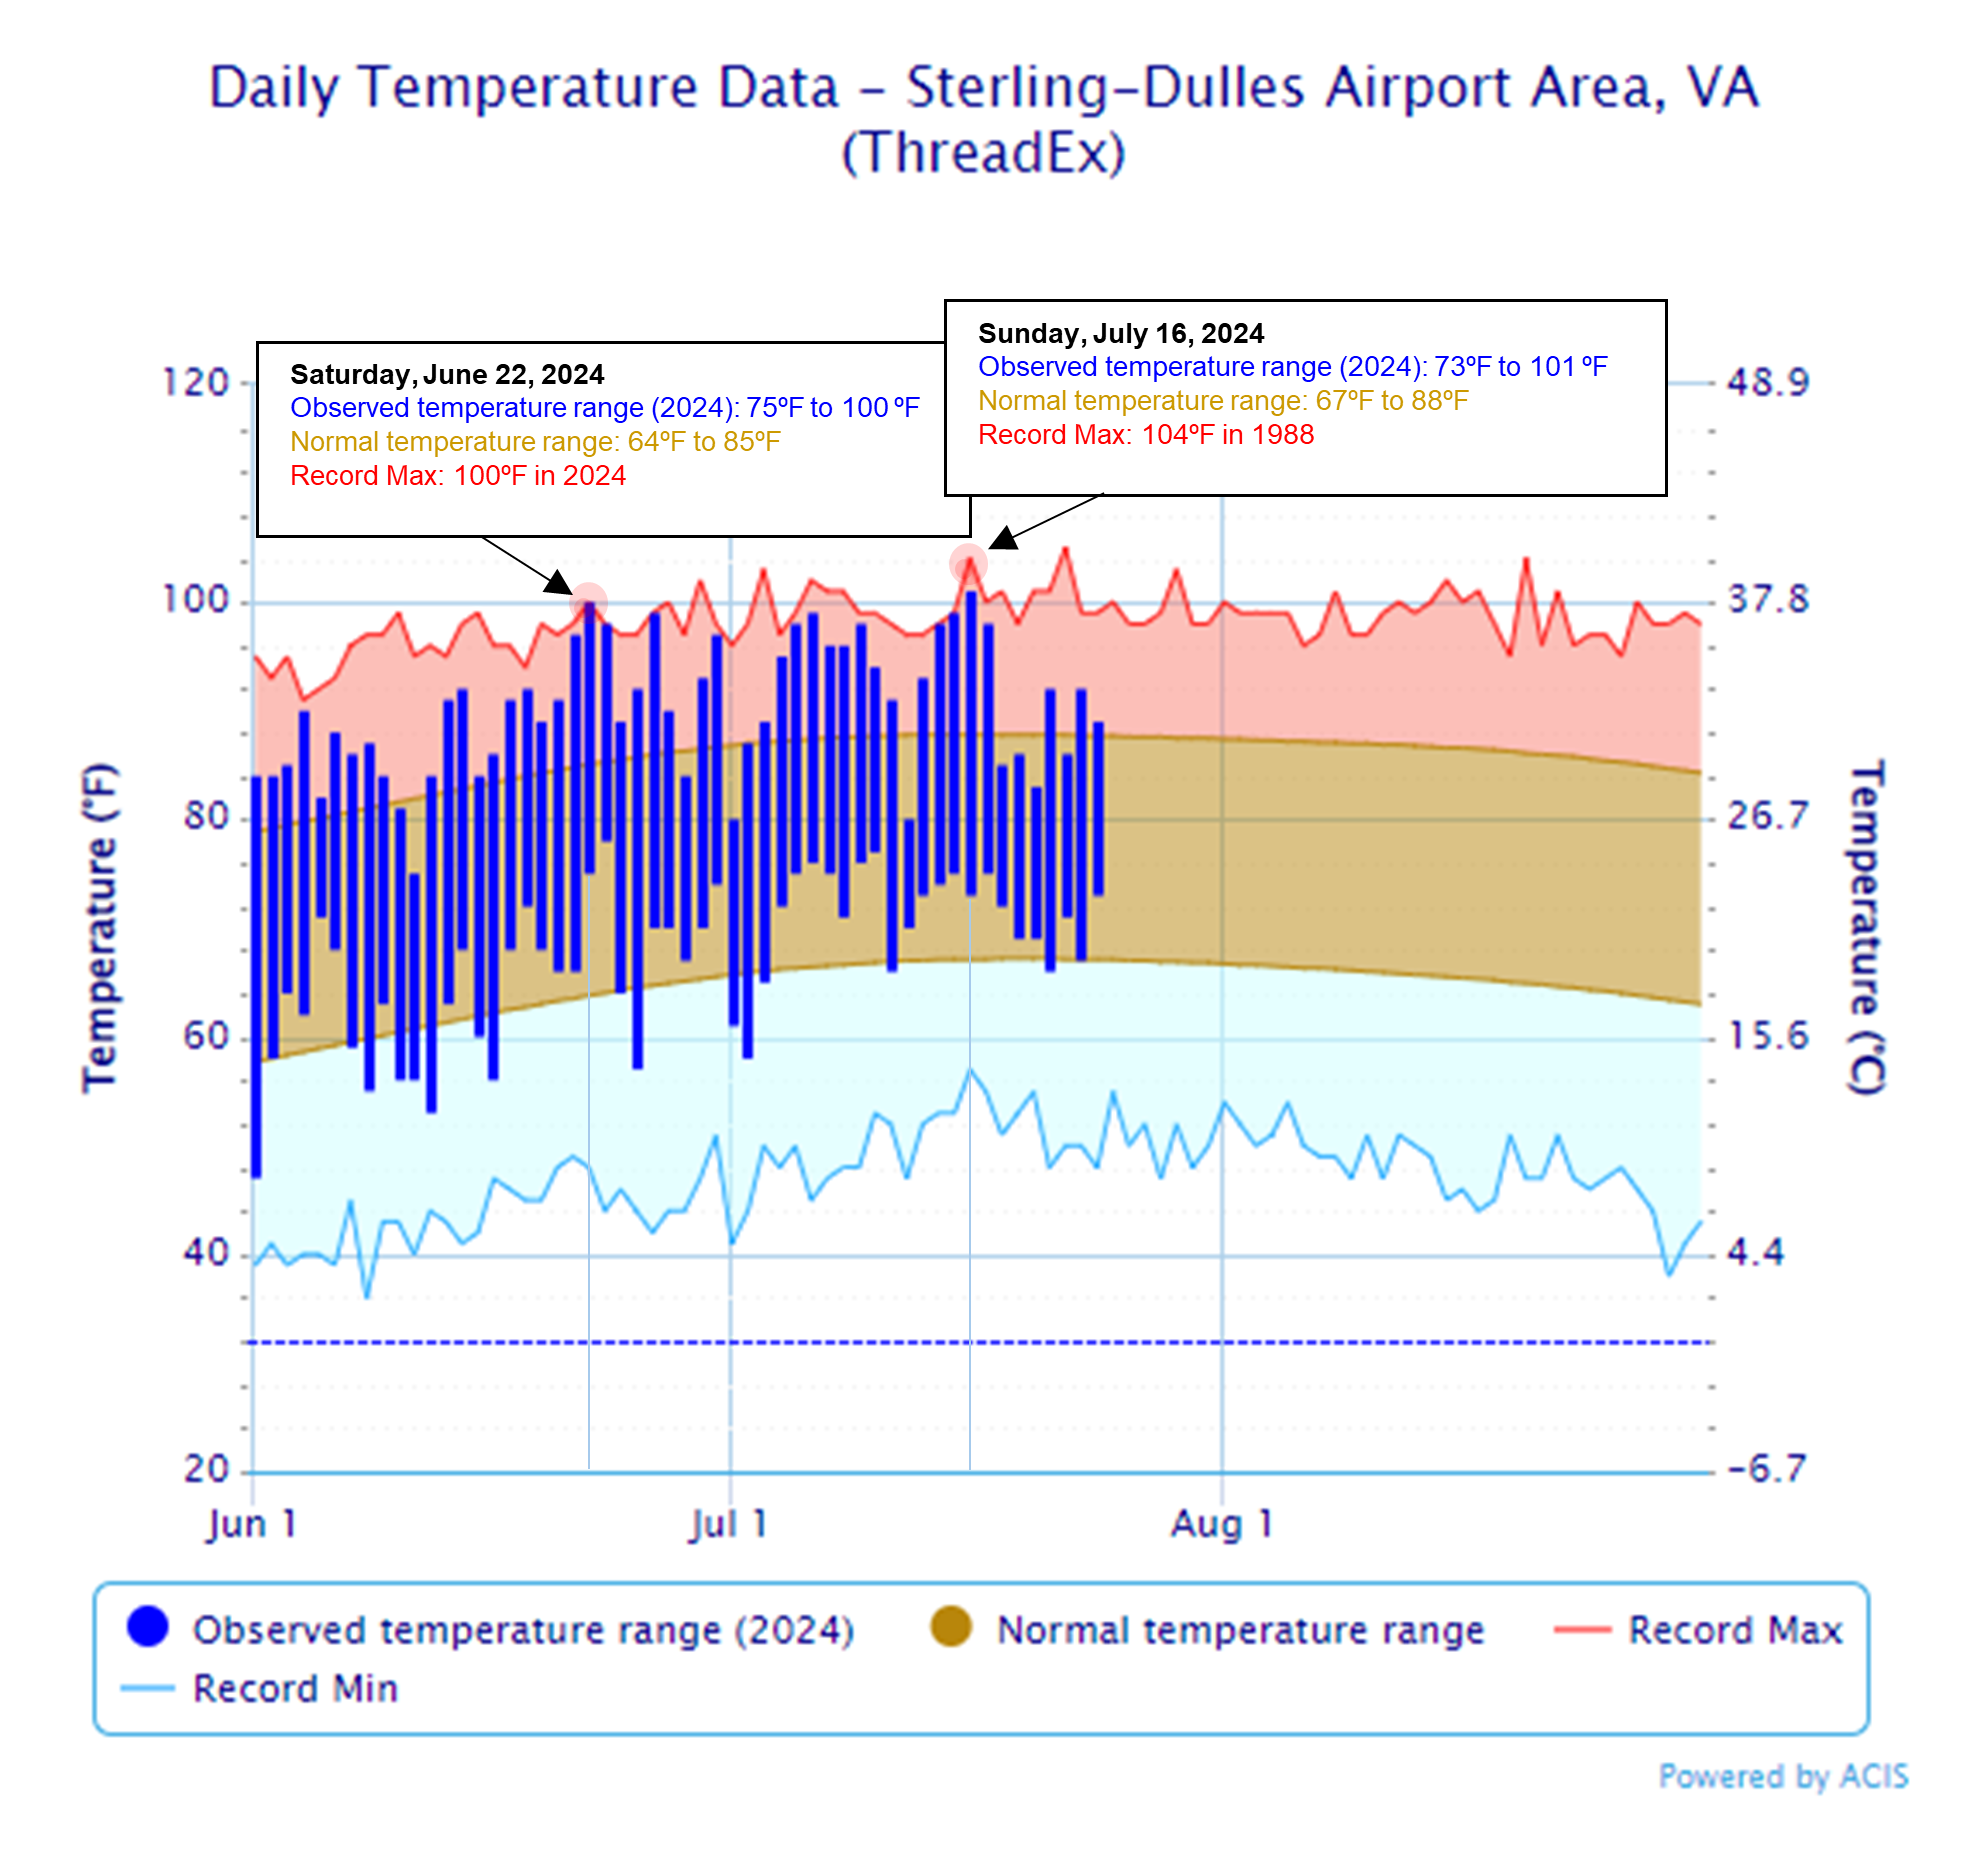
We also saw temperatures so hot on July 16 – a high of 101ºF – that the Washington Metropolitan Area Transit Authority (WMATA) reported tracks expanded and bent, closing that stretch of service. Read this article to learn more.
Between the baking heat outdoors and news alerts of extreme events on our screens, it feels like our weather is always breaking records. It’s important to understand the relationship between record-breaking weather and climate change so we can prepare in our daily lives and know how to adapt for the future.
Summer heat waves are not unusual, but what is record-breaking weather?
A scorching hot day feels extreme in the moment, but in July and August, temperatures in the high-90s are not unexpected. The heat dome of late June shattered records because it brought a full blast of summer earlier than usual.
When a single day has a record-breaking temperature, it means that temperature has never been reached on that date in that location. Usually, we can find out quickly that a day’s weather set a record, because weather stations compare the observed temperature to past temperatures. It’s important to consider the timeframe we’re referring to. For example, July 16 was the hottest day of 2024, but it didn’t beat the record for that day. That belongs to 1988, with 104ºF! Whereas on June 22, we did see a record high, with 100ºF. In the graph below, anywhere the blue bar touches the red line means an old record was broken.
When we hear that a whole month or year was record-breaking, it means temperatures recorded during that timeframe have been averaged together and compared with past records. This involves a lot of data, math, science, statistics – et cetera – and can cover small or large geographic regions.
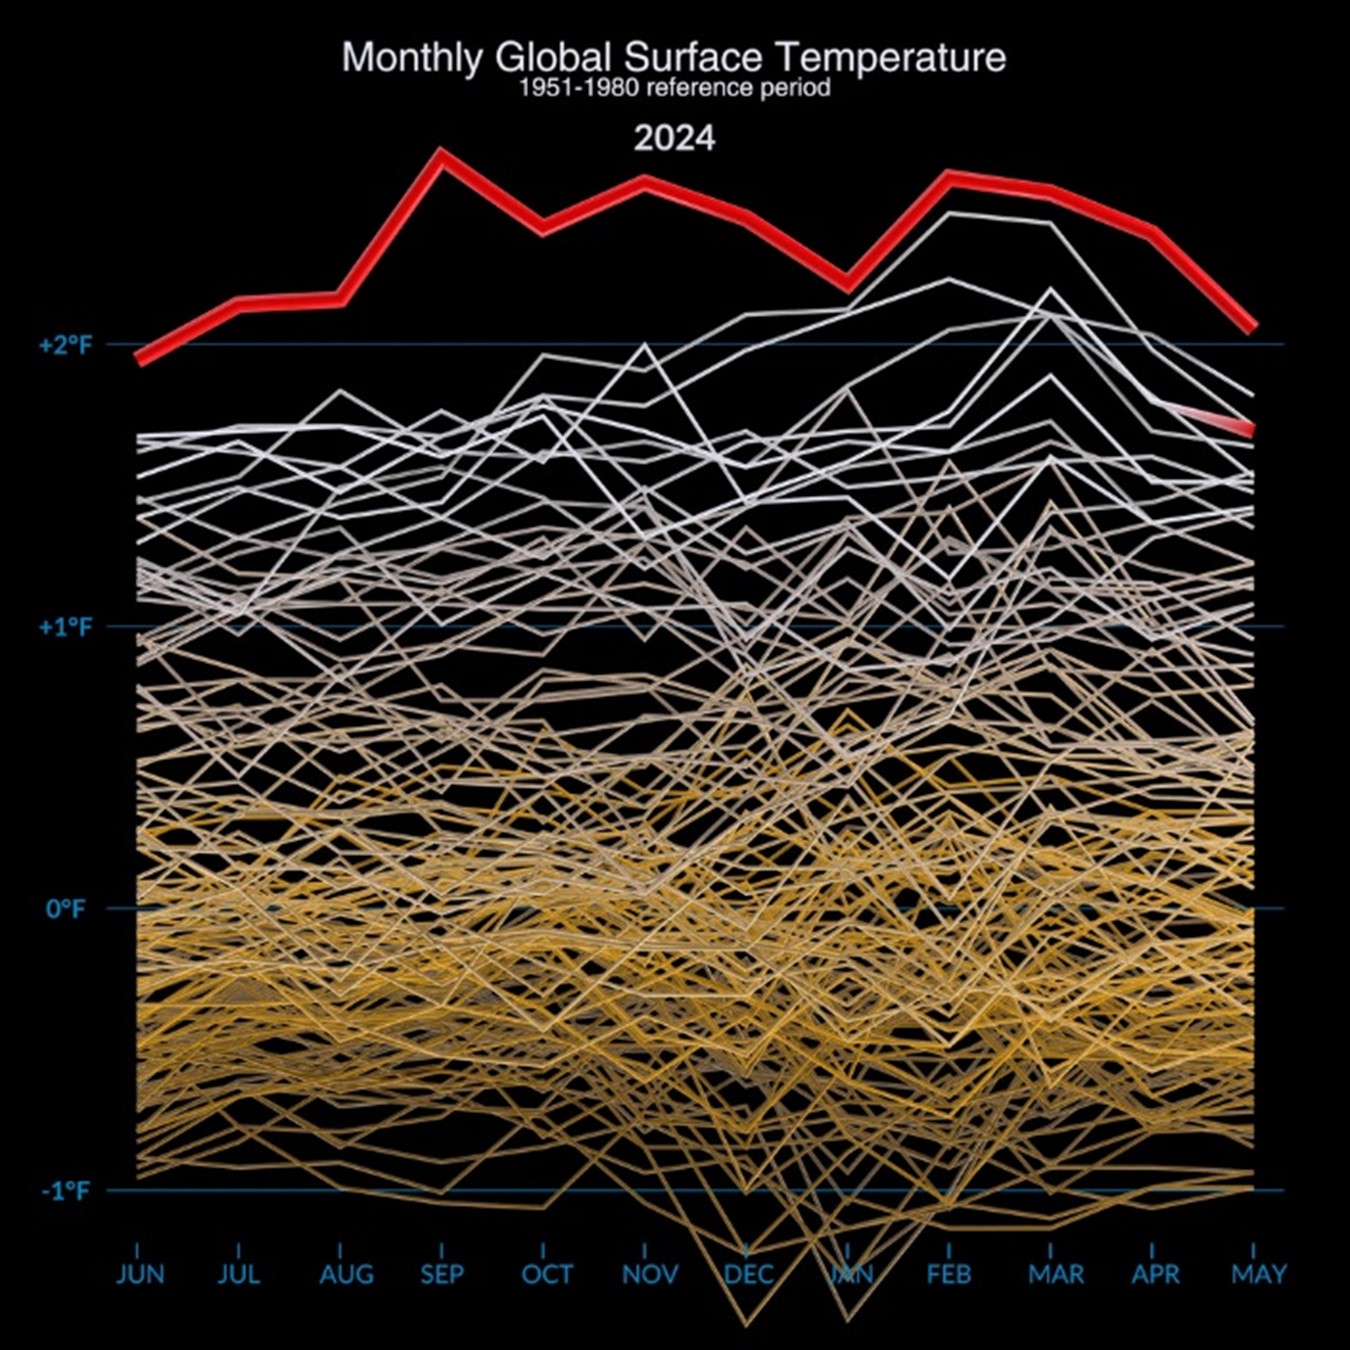
If you feel like you’ve heard about record breaking months a lot lately, you would be right. The National Aeronautics and Space Administration (NASA) confirmed that globally, we have experienced 12 consecutive months with the warmest average temperatures on record. The graphic below provides a visualization of that record showing how global surface temperatures have increased over time.
More record-breaking weather is an indicator that the climate is changing. Why?
Recall the relationship between “weather” and "climate” from our blog post, From Raindrops to Records: The Difference Between Weather and Climate. One term refers to the day-to-day meteorological conditions we experience and the other refers to those same conditions averaged over a 20-plus year span. If the atmosphere is left to its own devices, it ebbs and flows through its natural cycles over time. However, additional unnatural factors have started to impact the atmosphere.
Yep, you guessed it – greenhouse gas emissions. The term may sound like a broken record, but if you need a quick science refresher, we wrote about that, too! Check here: How Greenhouse Gases Are Changing our Climate and What We Can Do to Stop It.
Greenhouse gas emissions have been impacting our atmosphere for a long time, and we know that when we’re talking about our atmosphere over a long time, we’re talking about climate. The gradual warming causes our daily weather to change, which is why we are beginning to experience extreme temperatures more often, and why more and more record-high temperatures are occurring.
These record highs are the effect of a shifting climate, a signal from our weather that a change is underway. The graph below illustrates how a warmer climate results in record weather.
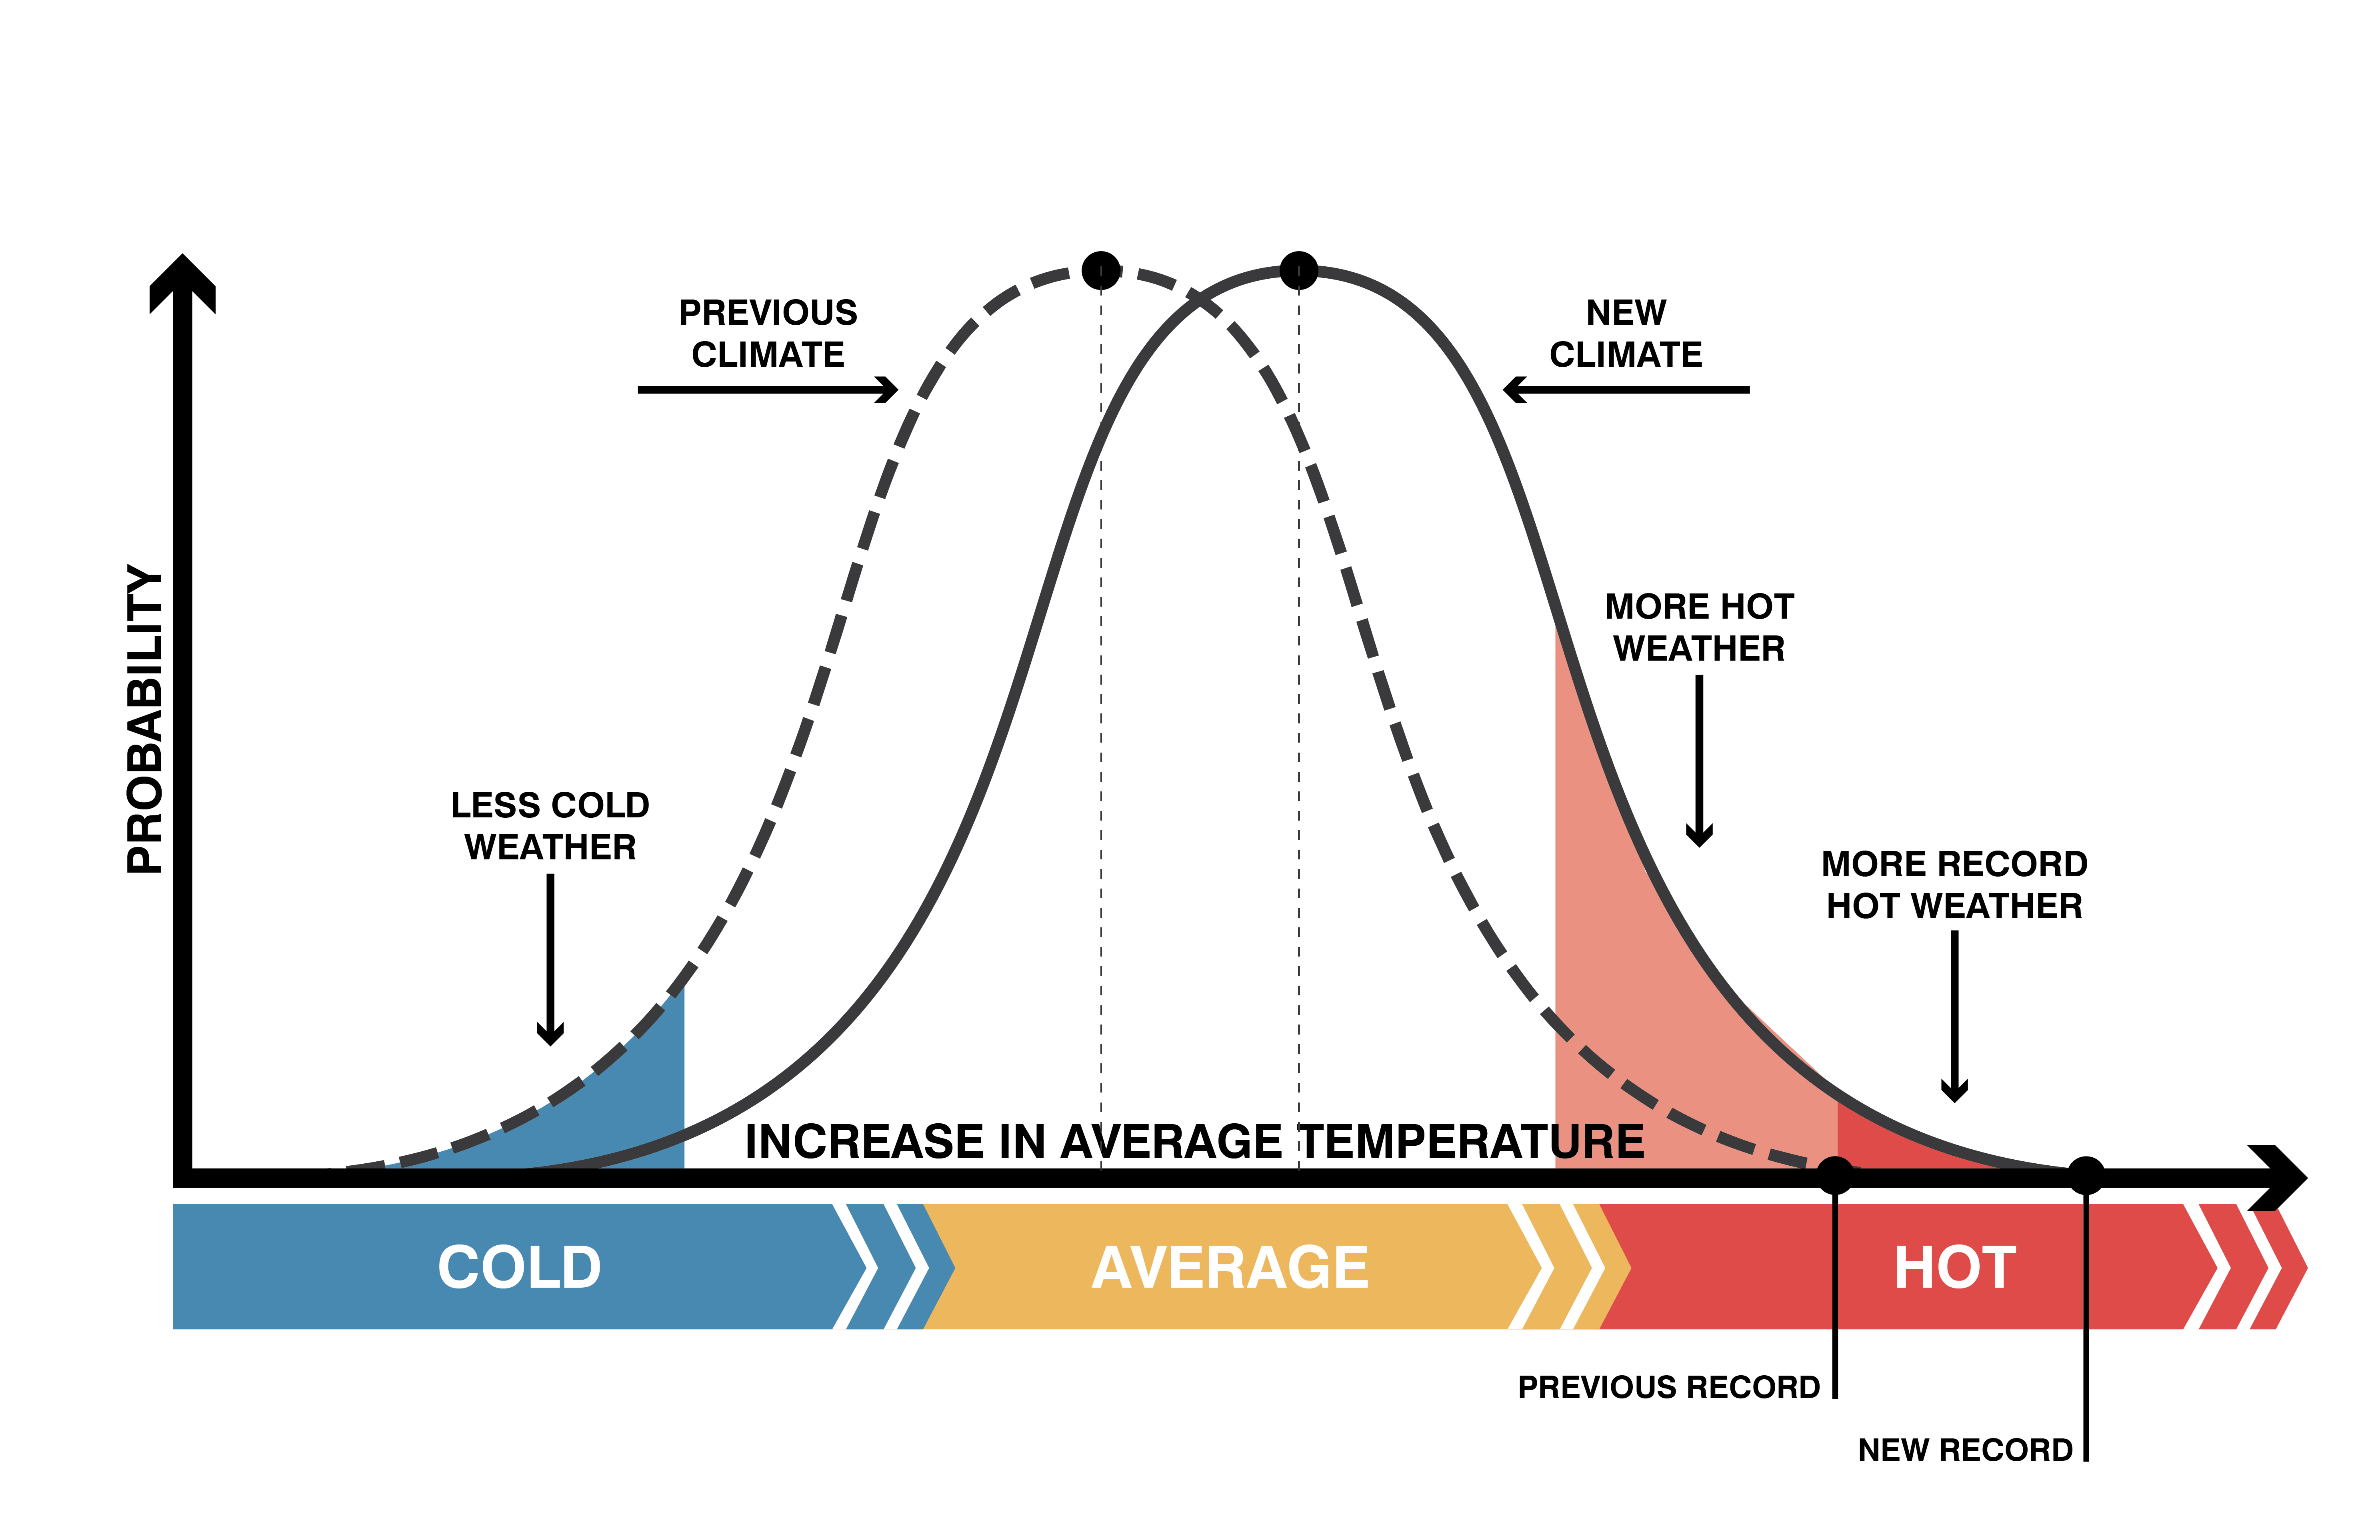
As you can see in the graph, even a seemingly small difference between the two curves makes hot weather more likely and makes a big difference in our day-to-day weather. It’s like getting a fever; just a few degrees noticeably impacts how we feel.
Extreme heat days are already increasing. How much warmer is it going to get in Fairfax County?
The graphic below visualizes a projection that tells us how many days above 90, 95, and 100 degrees we can anticipate on average each year in a scenario where emissions continue at a high rate. Between 2020 and 2035, we could see the number of extreme heat days double.

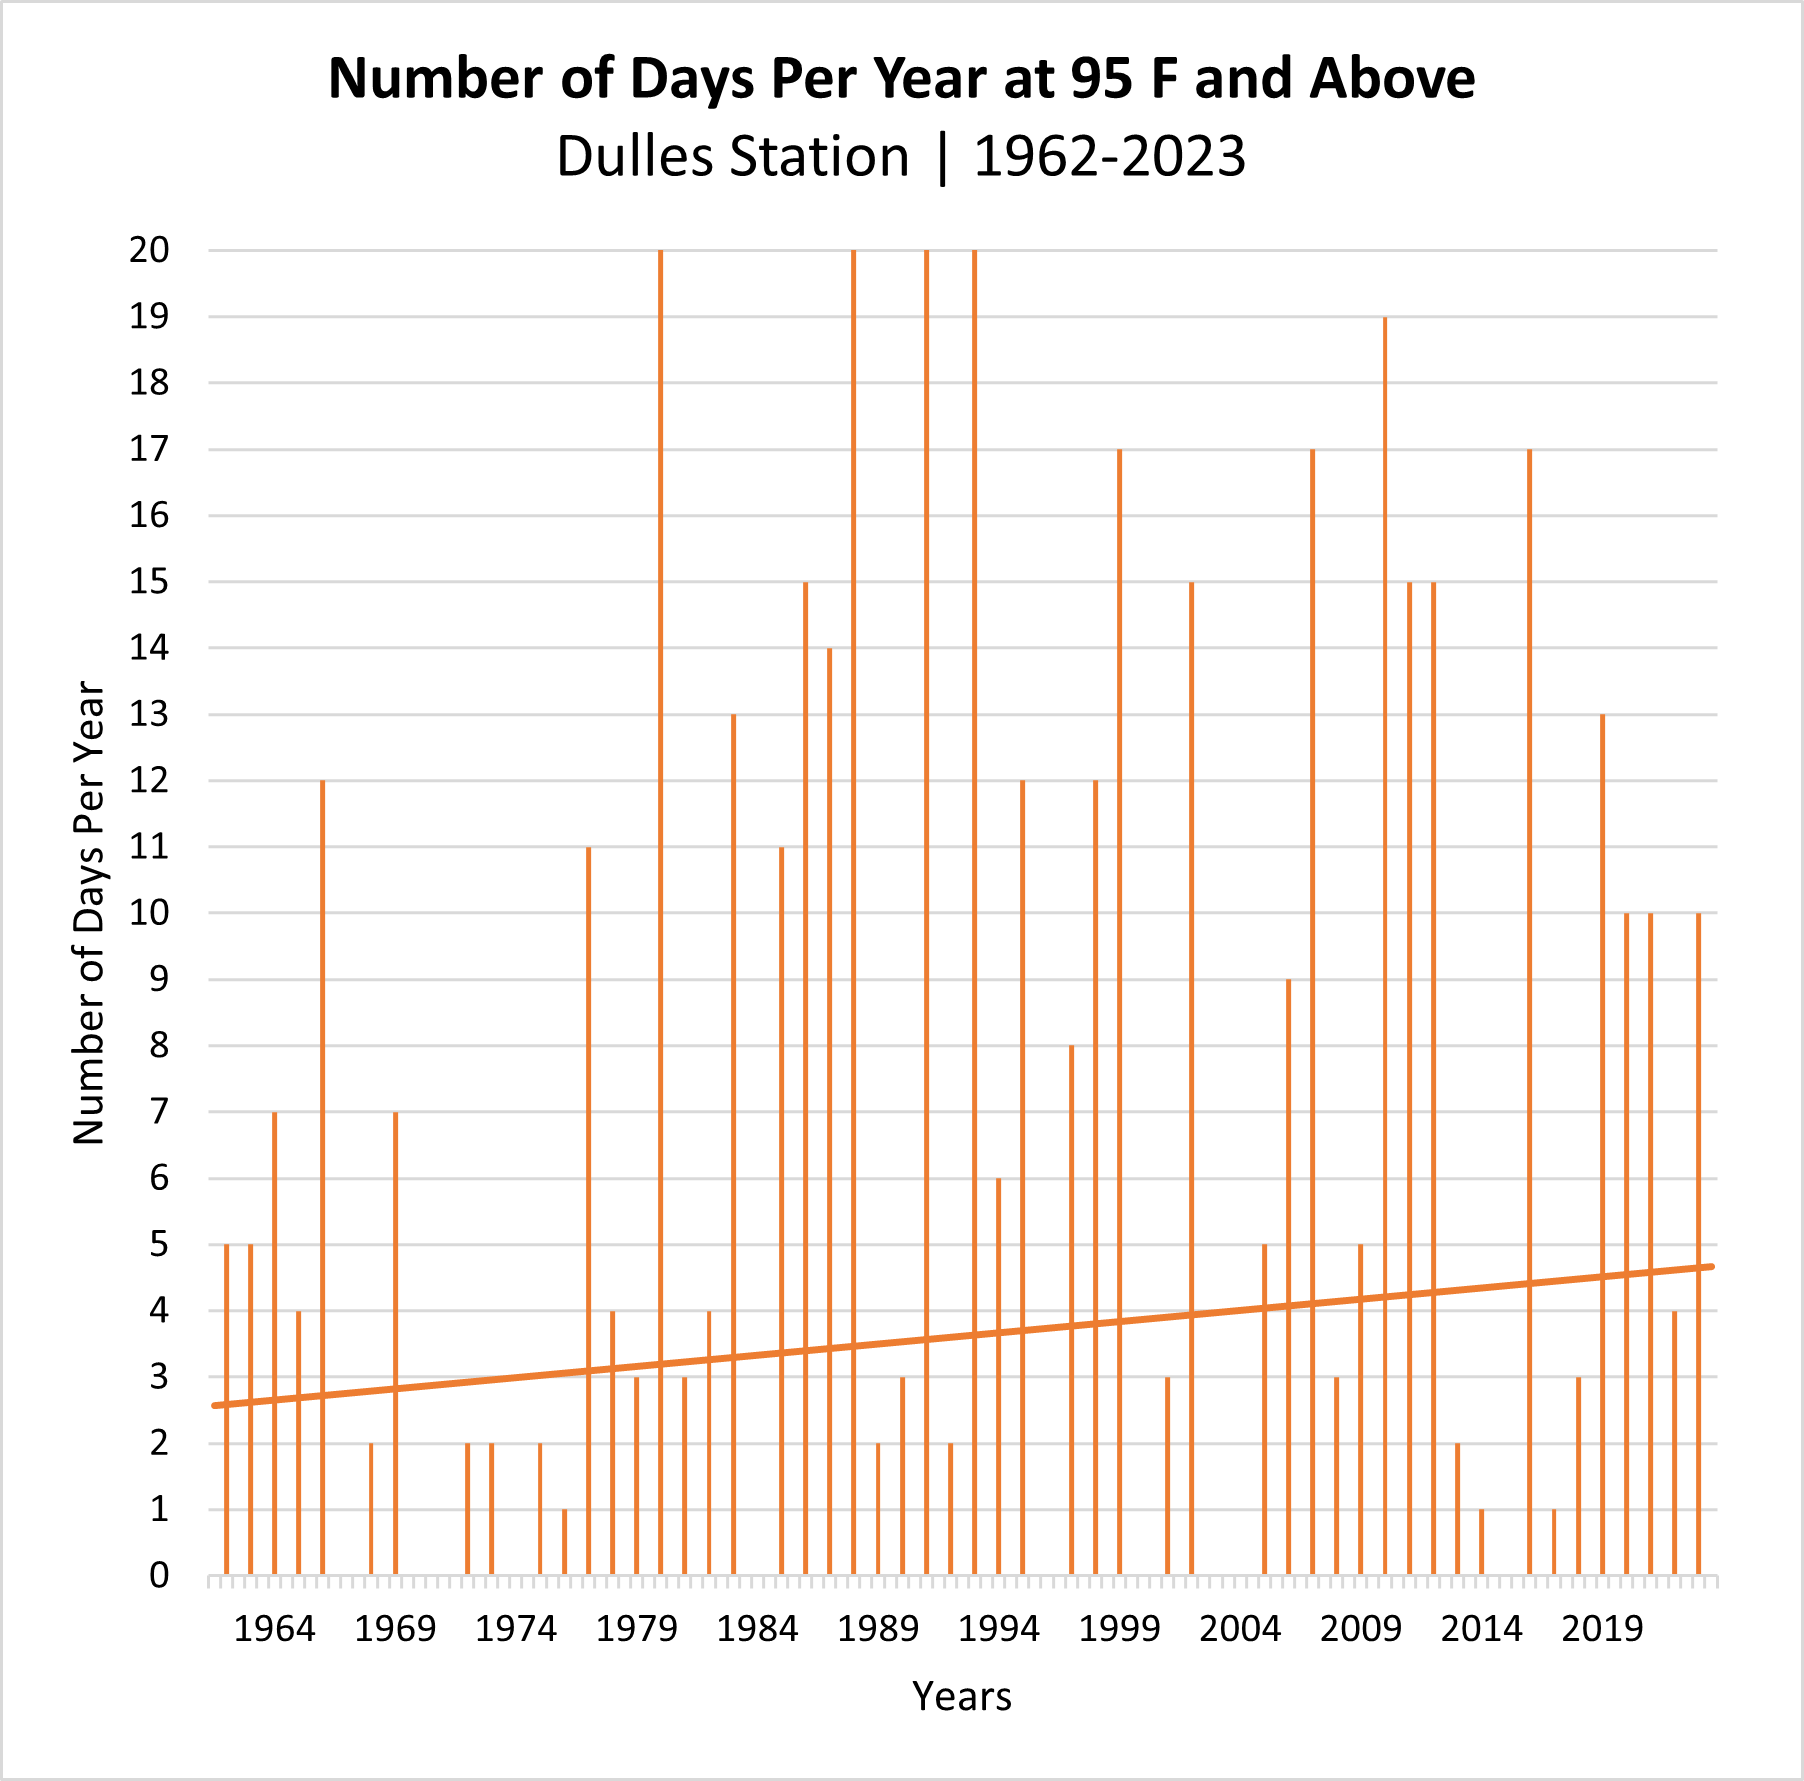
To contextualize the extreme heat of summer 2024, we can examine Fairfax’s climate using the graph below on the number of days per year at 95ºF since the 1960s. Notably, there have been several other years across the decades in which there were a high number of sizzling summer days. The key feature to note is the positive trendline, representing our average climate, which confirms we can expect more of these summers to come.
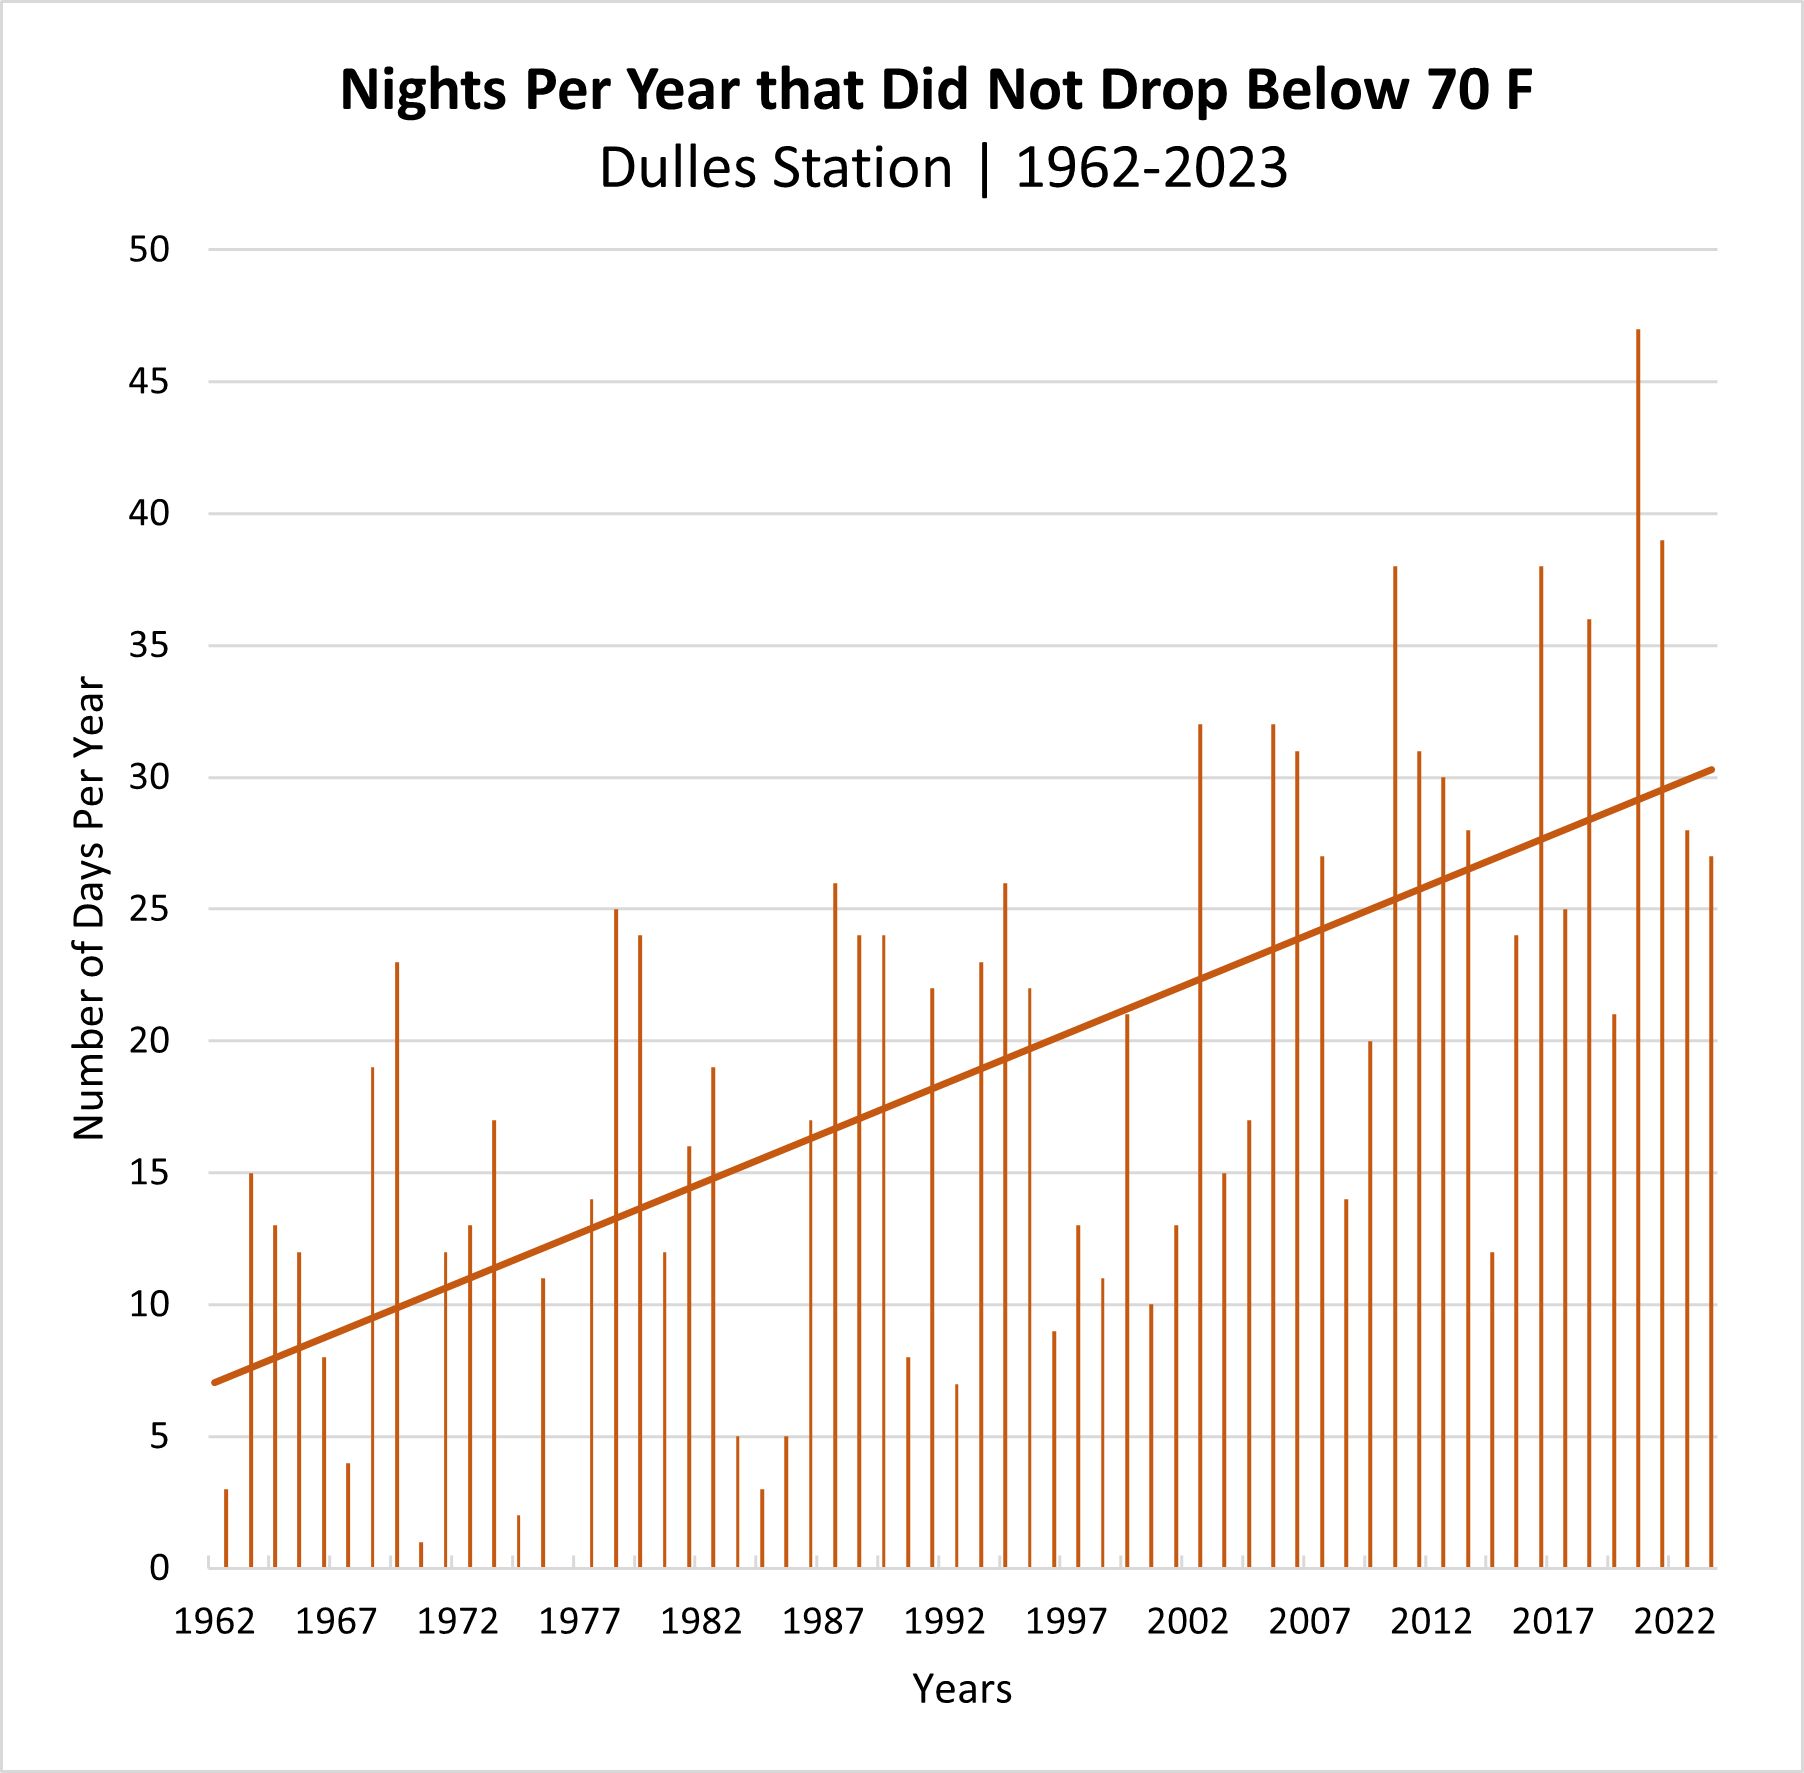
While the graph above looks at high temperatures, low temperatures also tell us about our warmer climate. The graph below counts nights where temperatures did not drop below 70 degrees, meaning there was no relief from the heat, which is of particular concern for residents without sufficient air conditioning or shelter.
Some of these visualizations may be alarming, especially if this summer has already felt relentless. But the good news is this information empowers us to be better prepared for the future.
Being safe and resilient in hot weather goes a long way. Here’s what you can do:
- Stay safe and learn the signs of heat-related illness and heat stress. Extreme heat is a dangerous and common hazard, but fortunately, being aware of what heat stress looks like can go a long way to prevent sickness for yourself and those around you.
- Stay hydrated. Be intentional about making sure your body has enough water by regularly taking sips of water and avoiding sugary or caffeinated beverages, which can affect your body’s ability to cool down.
- Stay cool, your body needs cool air for relief. Go to an air-conditioned space, or, if you do not have sufficient air conditioning in your home, locate your nearest Cooling Center during a heat advisory or go to a public space such as a mall, store, or movie theater. Take cool showers or baths. Do not rely on a fan for cooling, fans create air flow but do not lower your body temperature and cannot prevent heat-related illnesses.
- Stay protected. If you must be out in the heat, apply sunscreen periodically and wear clothing that is breathable and light in color, as well as a hat that shields you adequately from the sun.
- Stay vigilant. Check on neighbors or other family members who do not have adequate air conditioning. Don’t leave pets or people in a vehicle during the summer. Temperatures inside the vehicle can exceed temperatures outside.
- Stay resilient. You and your community become more resilient by being knowledgeable about extreme heat and helping keep each other safe. You can take extra measures by:
- Planting native trees in your yard or community, if you are able. Trees provide two types of cooling via shade and evapotranspiration. Adding shade near your residence can also lower your utility bills. Head to our webpage Find a Tree Planting Program for more.
- Opting for a cool roof during new construction or your next roof replacement if you are a homeowner. Cool roofs reflect light and heat back into the atmosphere, allowing less heat into your residence and lowering your utility bills. The U.S. Environmental Protection Agency's webpage offers more information: Using Cool Roofs to Reduce Heat Islands.
- Applying cool pavement coating or materials. Lighter-colored pavements work like cool roofs do, but there are also cool pavements made of materials that allow water to evaporate more quickly, cooling them down. The EPA's Using Cool Pavements to Reduce Heat Islands webpage has great information.
These are just a few of the many ways that can help make a warming climate feel a little more manageable.
For more health tips and guidance to beat the heat, visit Fairfax County's Extreme Heat Resources webpage. To learn more about what the county is doing to adapt to effects of climate change, visit the Resilient Fairfax webpage.
 Melanie Malsch joined OEEC in 2023 and is a community specialist with the office's climate planning team, which leads implementation for the county's climate adaptation plan, Resilient Fairfax. Melanie engages with community members and county staff and collaborates on initiatives that enhance local climate action and build community resilience to extreme heat, flooding, and severe storms. Melanie holds a degree in Environmental Studies from the University of Pittsburgh.
Climate Matters is the blog of Fairfax County’s Office of Environmental and Energy Coordination, where we share stories, insights and information related to climate change and environmental sustainability. Posts are written by knowledgeable and passionate OEEC staff members and guest authors. To read all blog posts, visit Climate Matters.