

Written by Allison Homer, Resilient Fairfax Program Manager 
This winter, snowballs have been flying, sleds have been sliding, and parents have been sighing in exasperation. It feels like an especially cold and snowy winter in Fairfax County. For those of us born before the turn of the century, this winter has had a touch of nostalgia. It brings back childhood memories of the days when gleeful kids played all day in snow-blanketed neighborhoods, not an iPad in sight.
If you’re a data nerd like us, you may be wondering how this winter fits into broader trends. Are our memories accurate about snow? Is this winter normal? A blip in the trendline? A freak cold spell? To answer these questions, we need to zoom out in two ways: 1) the long term, and 2) the worldwide.
Come with us to explore a winter wonderland of climate data in Fairfax County.
Generally, winters in Fairfax County are getting warmer.
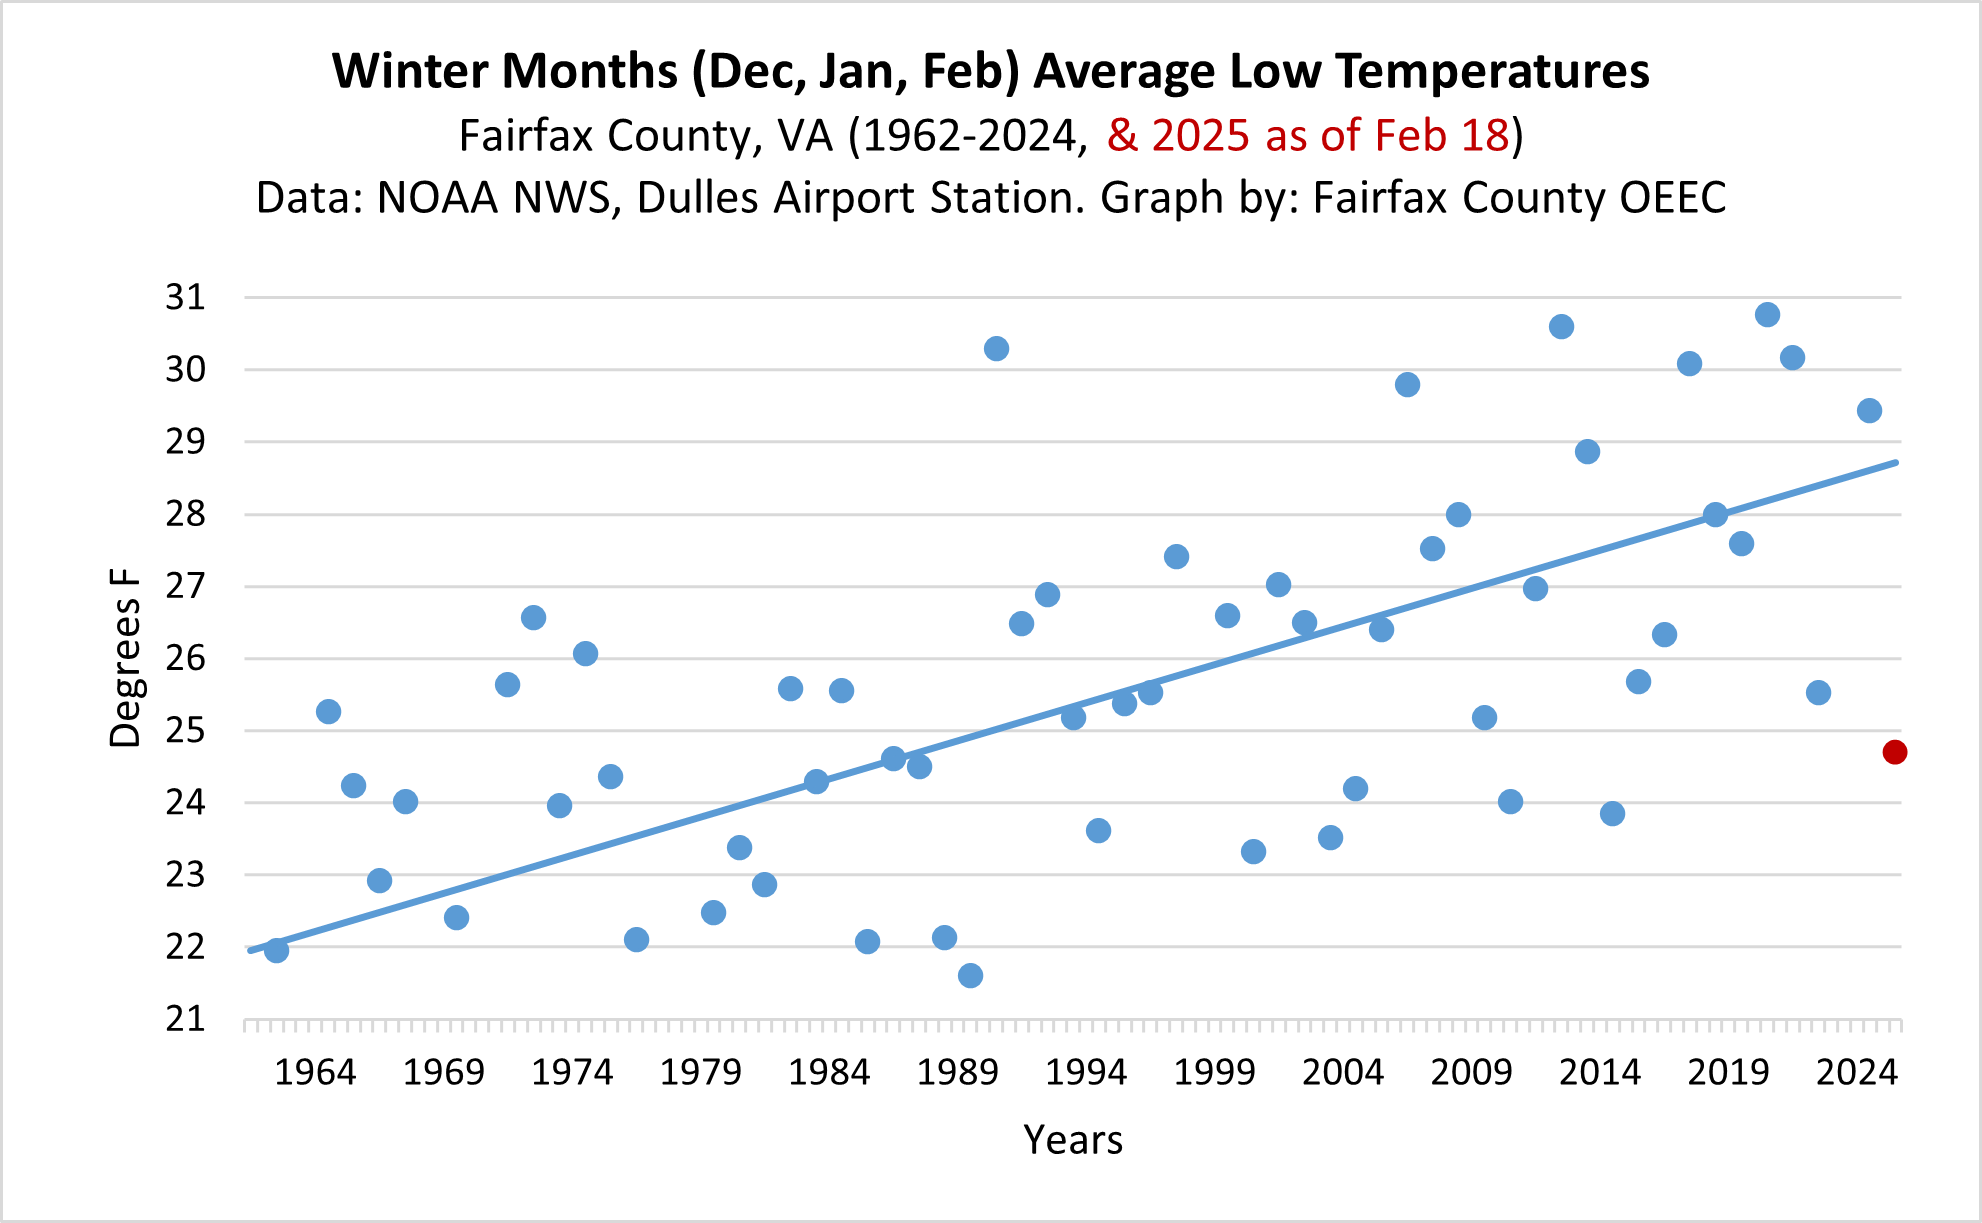
The 2024-2025 winter has indeed been very cold so far. (Please see the red dot on the far right in the graph below). However, over the past several decades, we’ve seen a clear increase in winter temperatures in Fairfax County. As shown in this graph, between 1964-2024, low temperatures in the winter have increased by 6-7 degrees F on average. In fact, winter temperatures are increasing faster than summer temperatures. (For more temperature trends, including full 2025 data once it is available, please see our Resilience Dashboard!)
This year, residents were surprised to see that the Potomac River froze over at times. History reminds us it used to be the norm in the winter. Historically, our water bodies froze reliably enough for big blocks of ice to be harvested as a crop before refrigeration technology. For example, George Washington’s enslaved workers used to harvest ice from the frozen Potomac, and similar ice harvesting was done at Walney Pond in what is now Ellanor C Lawrence Park.
It is hard for us to feel these longer-term warming trends when we’re in a cold spell. That’s why it is important to keep in mind the difference between weather (short-term trends), and climate (long-term trends of 20 years or longer). For a refresher on the difference between weather and climate, check out this blog post from my colleagues.
This winter, we are a cold spot within a larger pot of warming soup.
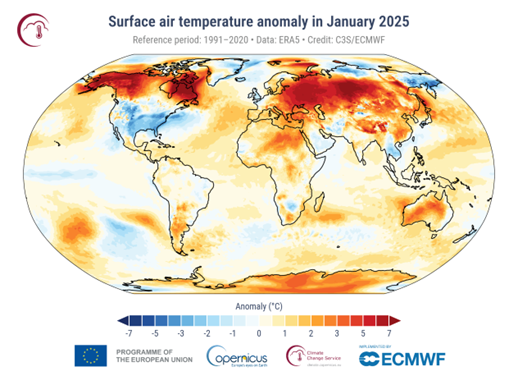
Have you ever microwaved soup, and when you go to take a bite, there is a random cold spot in an otherwise hot bowl? That is a good way to picture what the temperature maps looked like this winter. Globally, it was the warmest winter on record. It sure didn’t feel like it to us, though! That’s because the United States was in the cold blue patch shown on the map below, experiencing the coldest January since 1988, while almost everyone else was experiencing warmer-than-normal temperatures. The key takeaway here is: a cold spot in the soup doesn’t mean that the microwave isn’t on.
In the big picture, we can expect temperatures to continue to increase and winters to get warmer. However, the details are much more complex. Temperatures for a specific winter in a specific location depend on many things in addition to climate change, including El Nino/ La Nina, cloud cover patterns, and the status of the world’s ocean current “conveyor belt” (also known as the Atlantic Meridional Overturning Circulation), among other factors.
Enough about temperature. What about the snow?
In general, we’re seeing more storm events per year.
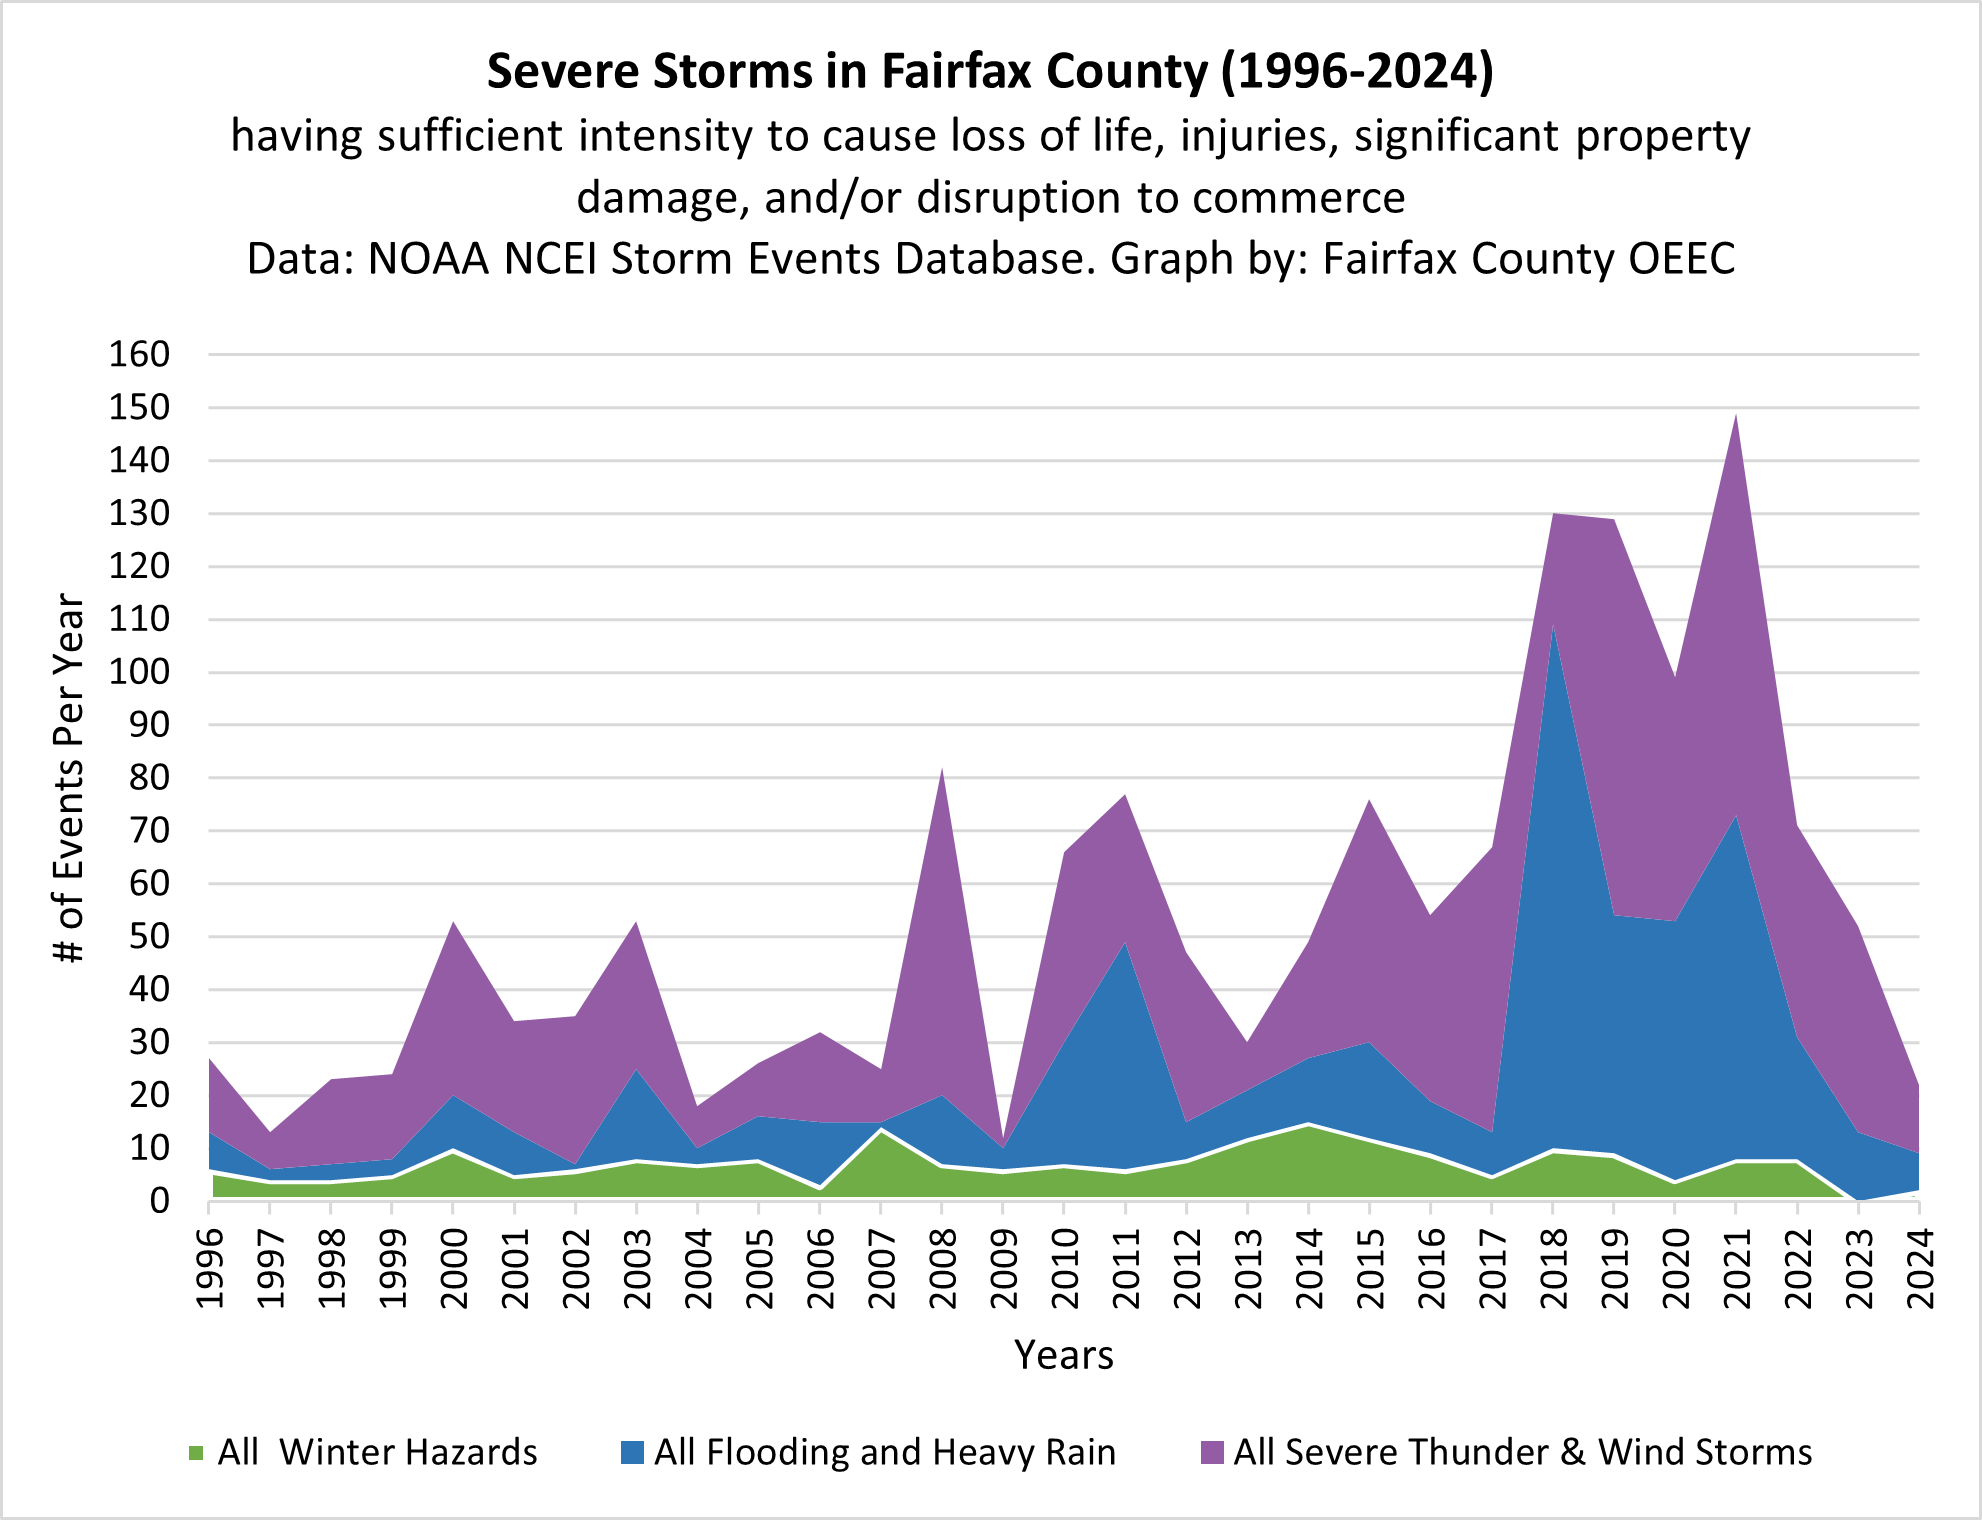
Our tagline for Resilient Fairfax is “warmer, wetter, weirder.” Storms definitely fit into the “weirder” category. As shown in the graph below, we are seeing more storm events per year that are intense enough to cause loss of life, injuries, or property damage. We have especially seen an increase in thunderstorms (shown in purple) and floods (shown in blue). Generally, this is because a warmer atmosphere holds more moisture. More moisture means bigger storms. This increase in storms is clearer with summer storms. (Note: this graph starts in 1996 because that’s when NOAA updated their methodology for storms.)
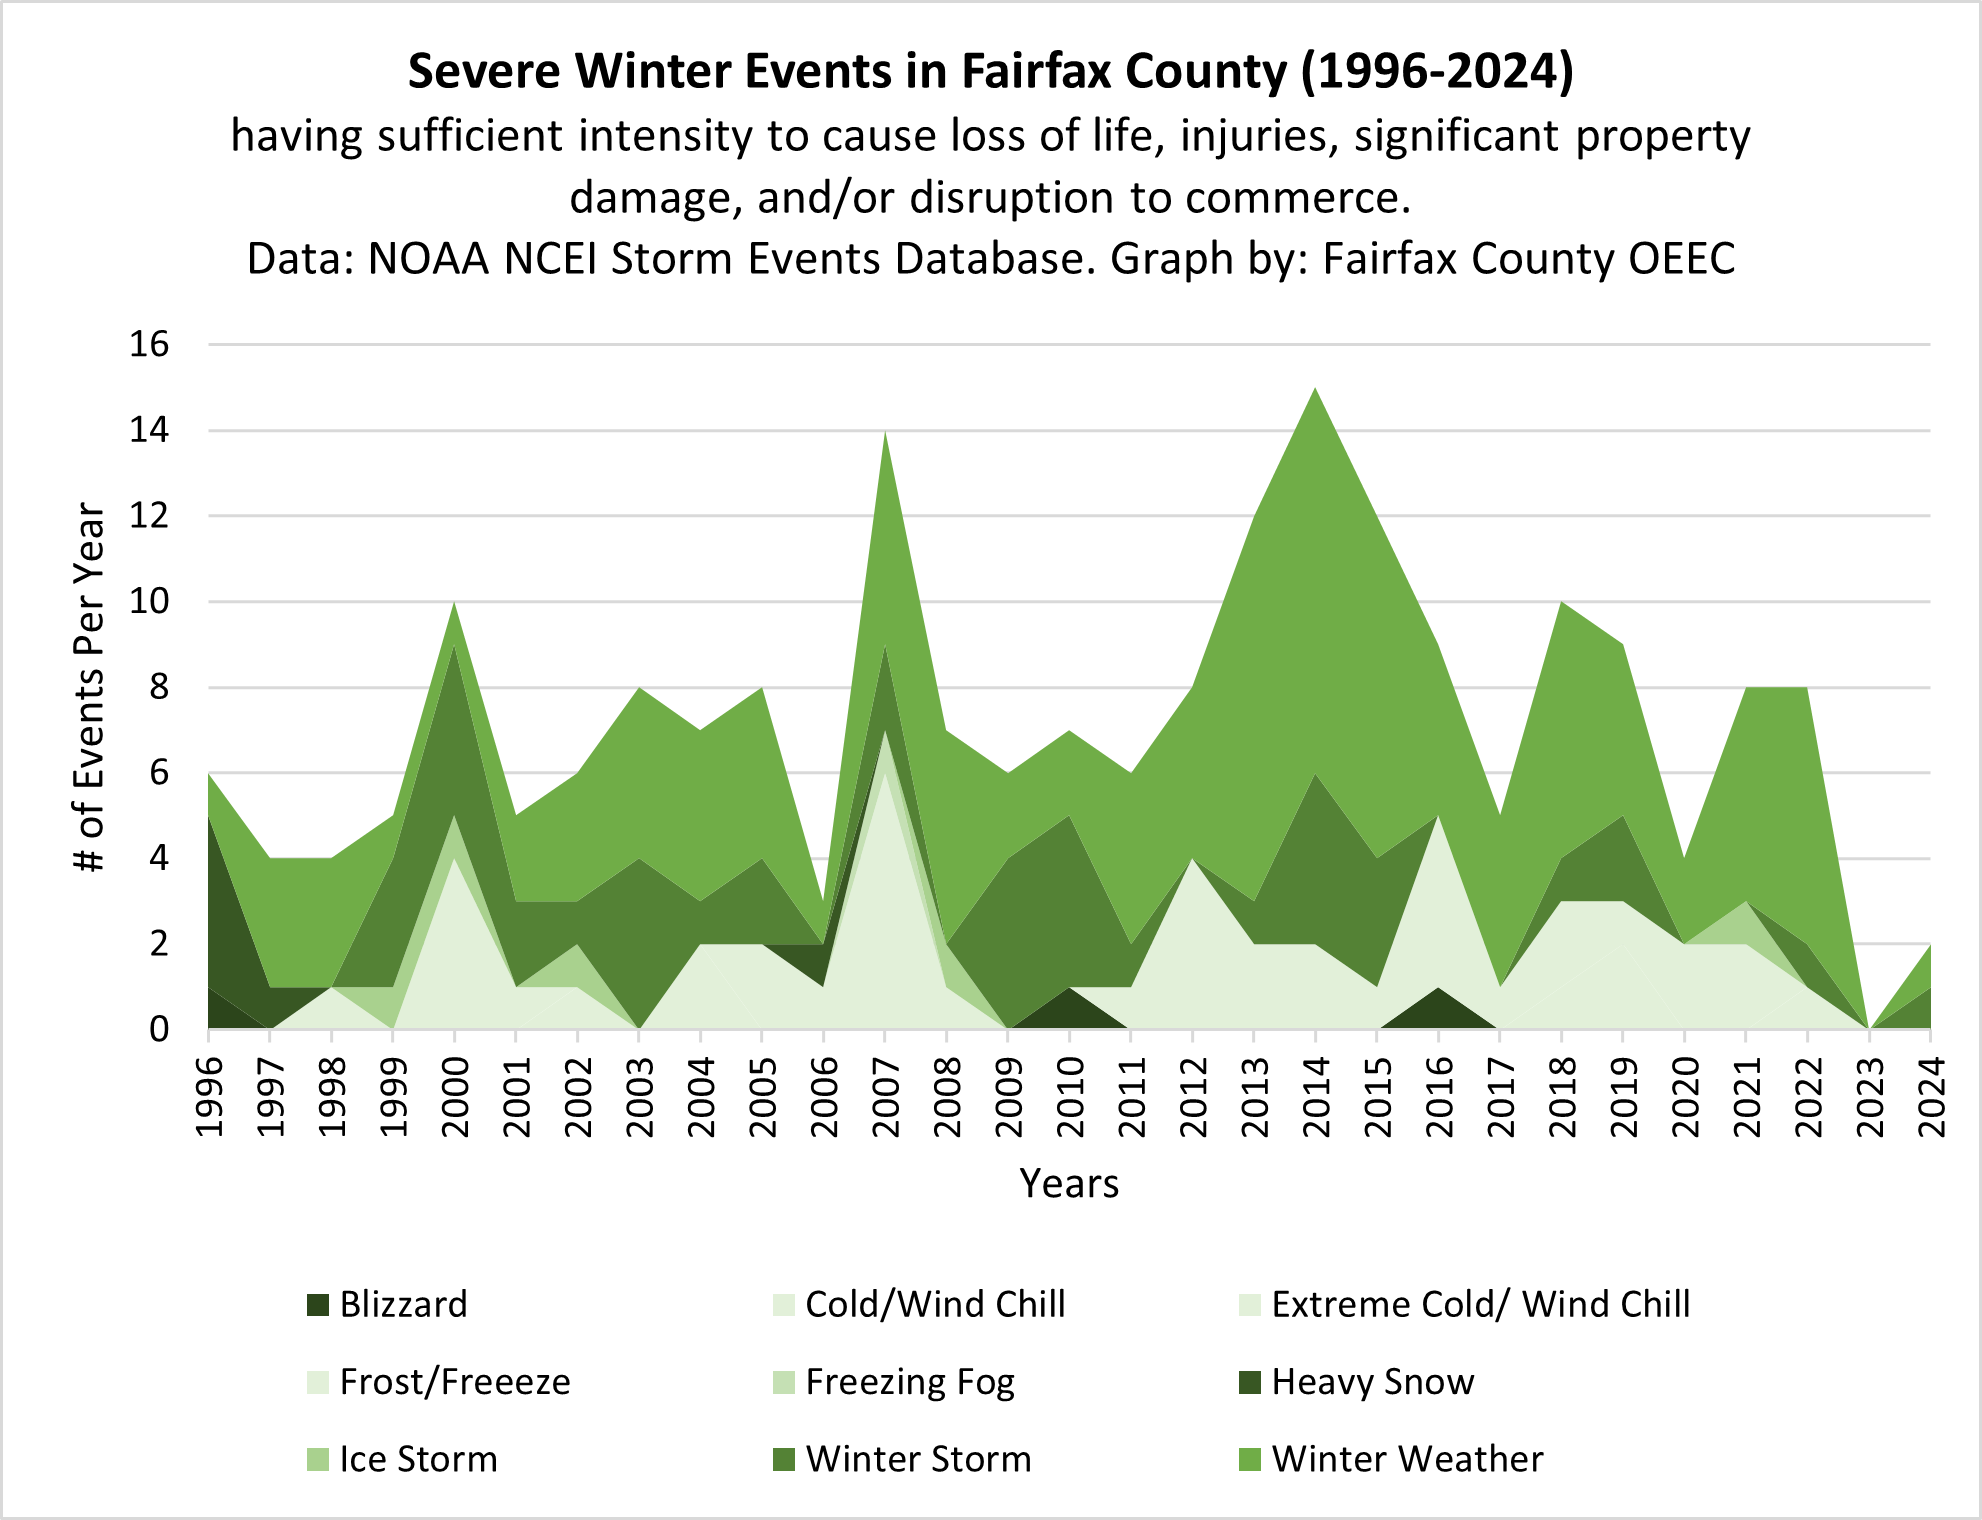
For winter weather, though, the trend is harder to predict.
In the graph above, winter hazards like blizzards, winter storms, and ice storms are shown in the small green band across the bottom. Let’s zoom in on that winter data in the graph below. When we look at winter weather only, we can see that the trend is messier and harder to predict than other types of storms. There isn’t a very clear pattern. On one hand, warming temperatures generally mean less chance for snow, because it falls as rain instead. However, in this new climate, storms are also more intense, so when it does snow, it can sometimes be quite heavy. As a result, it is harder to identify a trend overall.
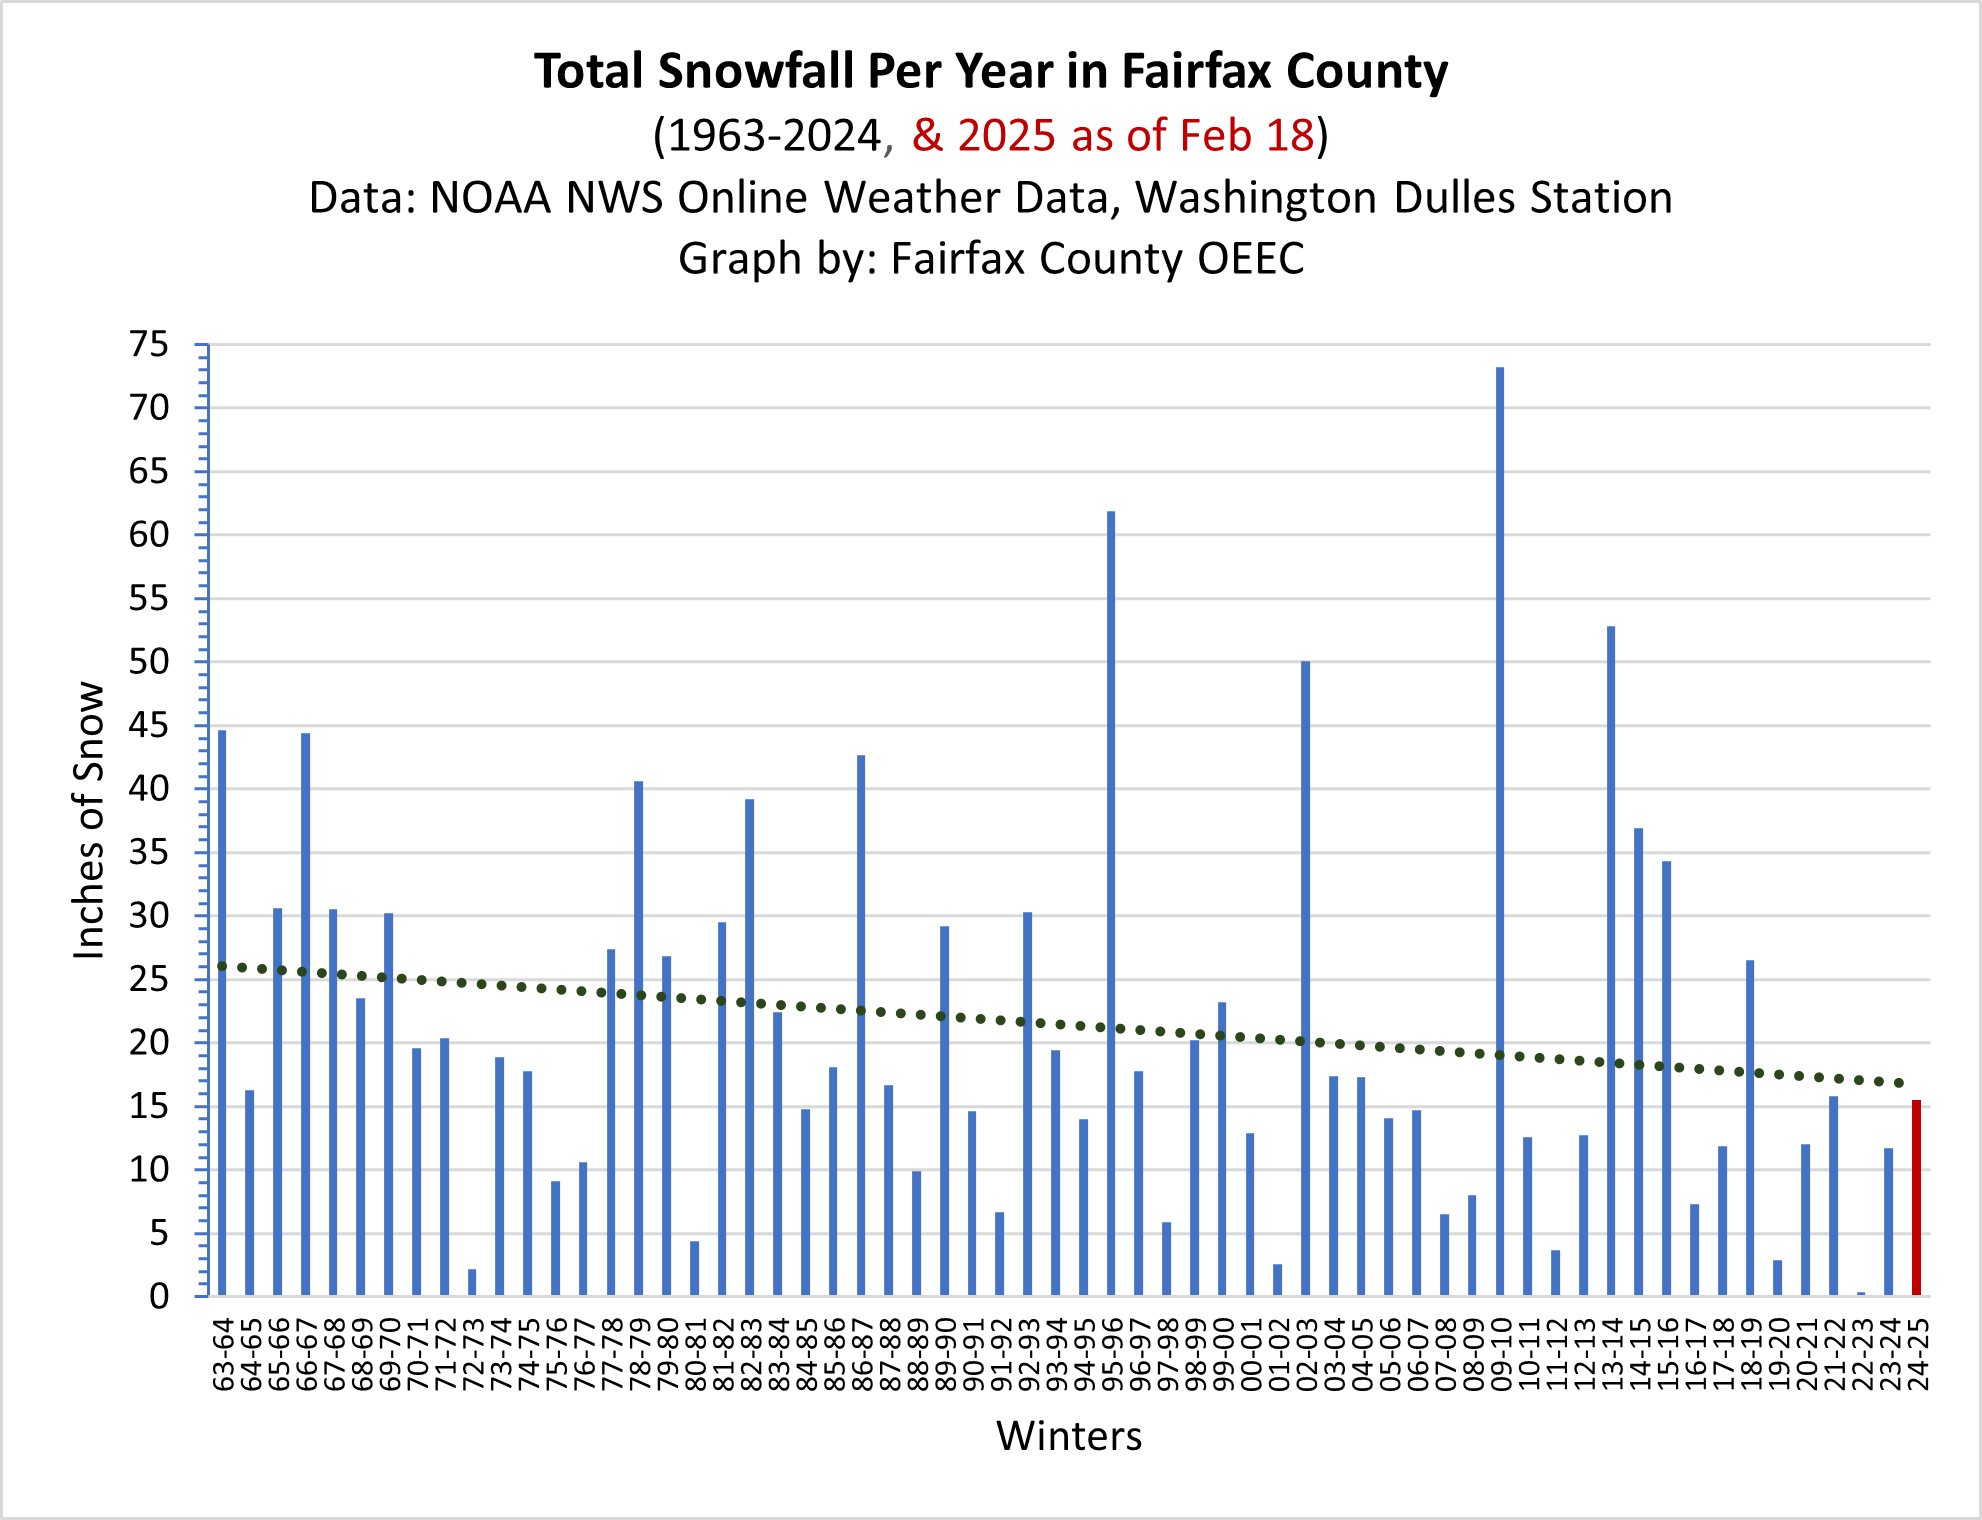
Snowfall has decreased slightly over time.
Another way to track winter weather over time is by looking at total snowfall per year. As shown in the graph below, snowfall is also a bit chaotic. There are major outliers, such as “Snowmaggedon” in 2010, that tower above all the rest. Generally, our total snowfall has decreased over time, but it has also gotten more erratic (meaning it swings more wildly between all or nothing). The decrease overall can be seen in the black dotted trendline in the graph below. Our snowfall so far this year (15.5 inches) can be seen in the red bar on the far right. (This graph includes data through February 18, 2025).
Conclusions
The climate in Fairfax County is getting warmer, wetter, and weirder in the long-term. However, cold, snowy winters like this one still exist! Winter is the most erratic season, so it is the hardest to predict. For now, enjoy being bundled up with some hot cocoa. Summer heat will be here before you know it!
Want to learn more?
To learn more about climate trends in Fairfax County and the Resilient Fairfax program, please see the Resilient Fairfax webpage.
 Allison Homer is the Resilient Fairfax Program Manager and a climate planner for the Fairfax County Office of Environmental and Energy Coordination. In her role, she coordinates with staff from 25+ county agencies to help the county create climate-ready communities, resilient infrastructure and buildings, and adaptive environments. She holds an environmental Master of Urban and Regional Planning (MURP) degree, a Global Master of Natural Resources (GMNR) degree, and a Graduate Certificate in Global Sustainability from Virginia Tech, in addition to a Bachelor’s degree from Wake Forest University. She is certified by the American Institute of Certified Planners (AICP) and a LEED Accredited Professional for Neighborhood Development (LEED AP ND).
Climate Matters is the blog of Fairfax County’s Office of Environmental and Energy Coordination, where we share stories, insights and information related to climate change and environmental sustainability. Posts are written by knowledgeable and passionate OEEC staff members and guest authors. To read all blog posts, visit Climate Matters.