Key Metrics
For an ADA accessible version of this graphic, please email ResilientFairfax@fairfaxcounty.gov.
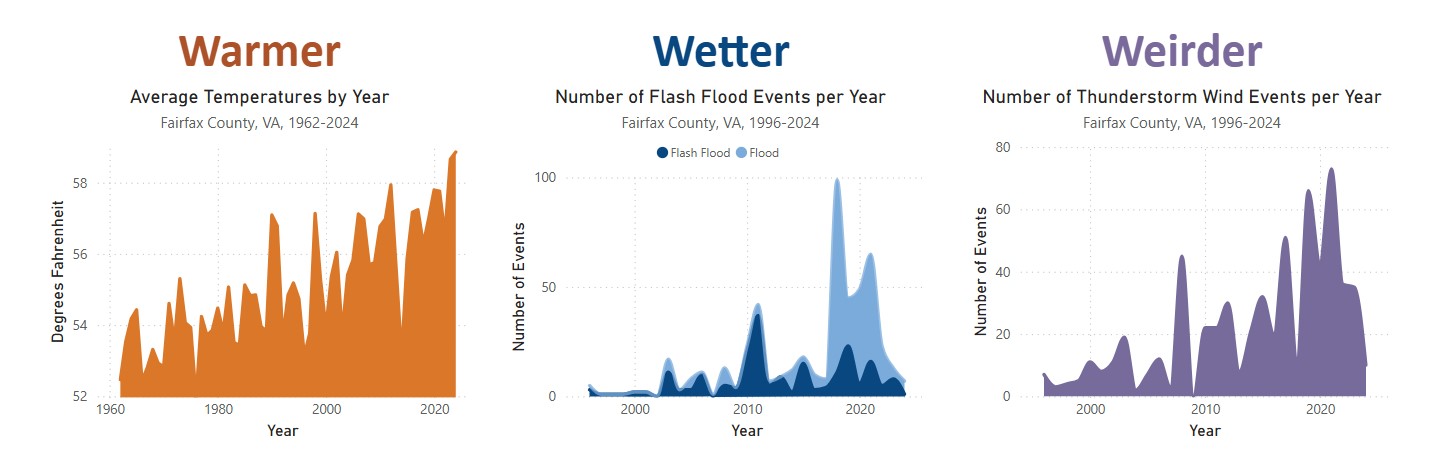
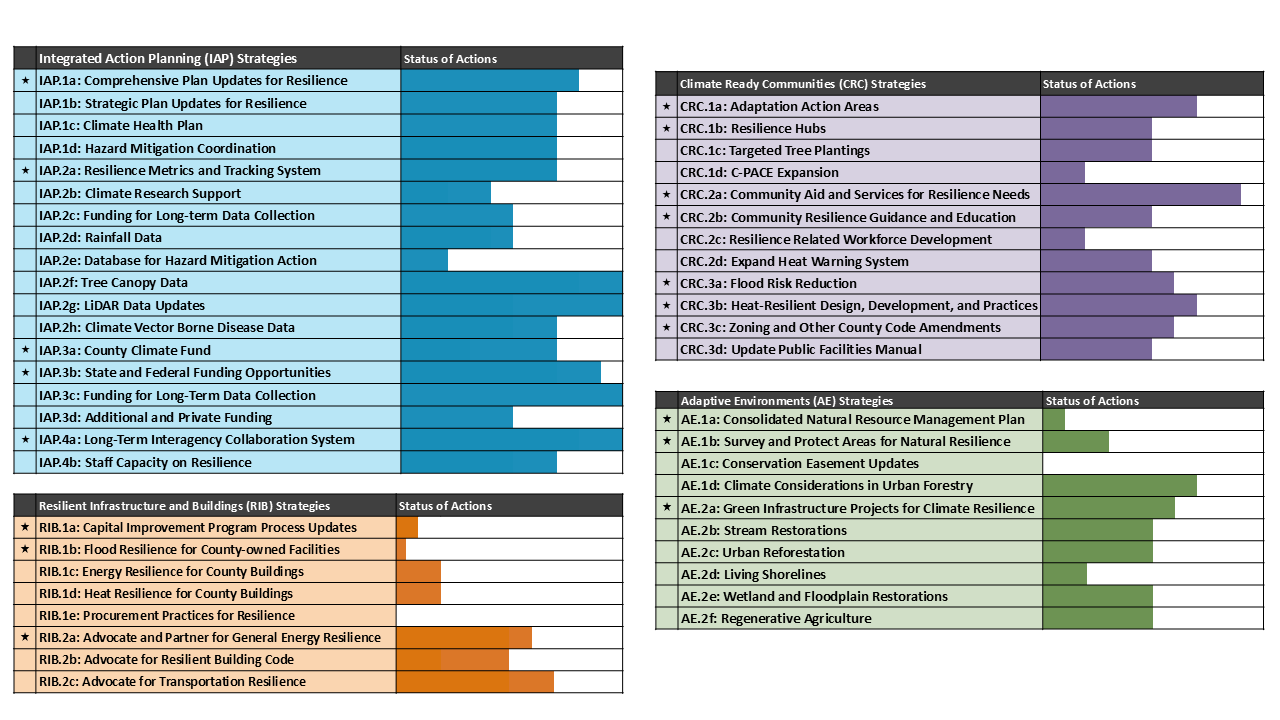
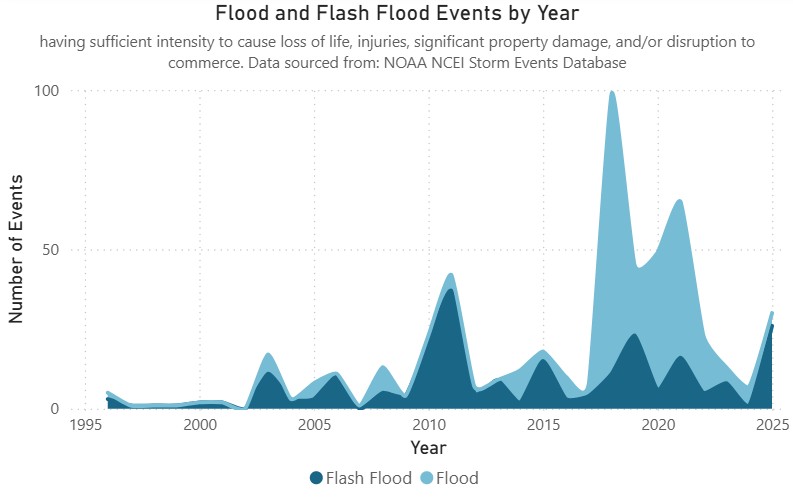
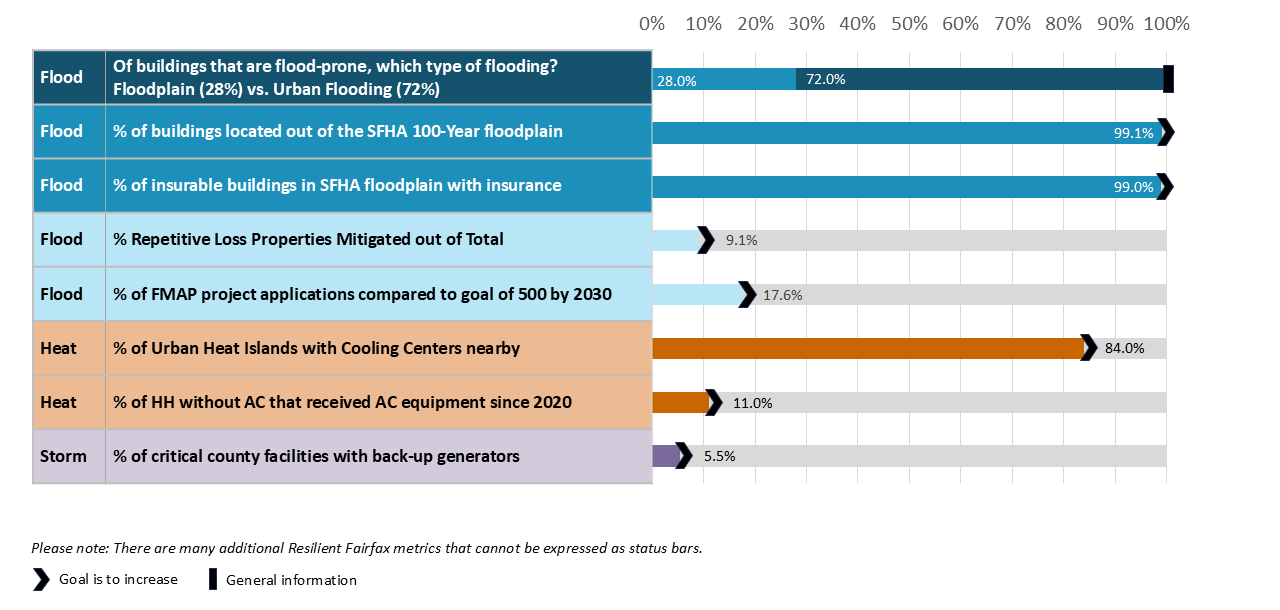
Are we resilient to climate hazards? To answer that question, the county tracks dozens of climate resilience metrics, based on the Key Performance Indicators from the Resilient Fairfax plan. A few key metrics are shown in the figure above.
In terms of flooding, people often think of floodplains, which are the strips of land next to rivers and streams. However, in Fairfax County we have urban flooding in addition to riverine (floodplain) flooding. In terms of floodplain (riverine) flooding, Fairfax County has reduced its risk by proactively protecting floodplains and limiting development. Few structures (0.9% of buildings) in Fairfax County are in floodplains, and nearly all of those (99%) are insurable buildings that have flood insurance, because it is a requirement for a federally backed mortgage. (Data is based on the 2010 FEMA FIRM). Outside of floodplains, however, urban flooding is an issue. Out of all buildings at risk of flooding in Fairfax County, approximately 28% are in floodplains, while the remaining 72% are vulnerable to potential urban flooding. (The data shown here is based on DPWES’ Analyzing Flood Risk Story Map.)
The county is addressing these flooding issues through a combination of policy updates, capital projects, and community services. In terms of community services, the Conservation Assistance Program continues its success, and the Flood Mitigation Assistance Program (FMAP) was launched in July 2024. FMAP has a goal of approximately 100 projects per year, which would mean approximately 500 projects by 2030. A total of 88 FMAP applications have been approved through 2025, or 17% of the 2030 milestone.
To adapt to increasing heat, the county provides Cooling Centers, cooling programs, tree planting, heat-resilient design, and more. Our Cooling Centers provide good coverage of the county. Specifically, 84% of our heat-vulnerable areas have a Cooling Center within 1 mile*. In terms of air conditioning access at home, progress has been accelerating. An estimated 2,460 households in Fairfax County need help with air conditioning equipment at home, based on a new analysis of Department of Tax Administration data on the HVAC status of homes. To date, 274 homes (11.1% of those in need) have received AC equipment installations, drop-offs, repairs, or replacements from the county’s cooling programs (Cooling Assistance, Senior Cool Care, and AC Rescue). The launch of AC Rescue in 2024, funded by Resilient Fairfax, helps to fill gaps that cannot be served by the other programs.
For storm resilience, there are also opportunities for enhanced resilience using back-up power sources. Of the 312 county government facilities on the county’s Continuity of Operations list, 17 facilities, or 5.5%, have generators.
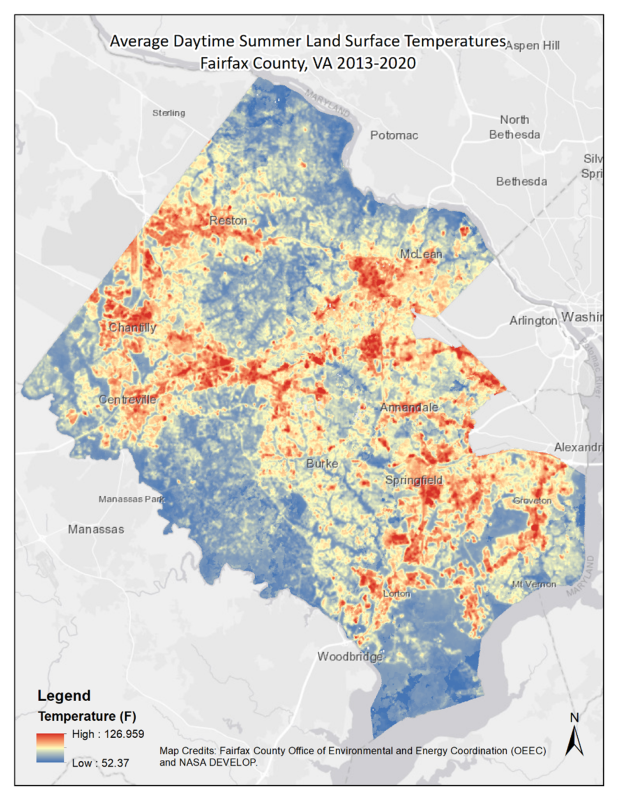
*Using NASA satellite data, the county mapped the land surface temperatures across the county and then summarized those temperatures by Census Tract (Heat Exposure Index). Then, the county mapped populations that are more heat-sensitive, due to factors such as age, health conditions, poor housing conditions, and less ability to afford air conditioning (Heat Sensitivity Index). When these two maps are combined, we get the Heat Vulnerability Index. The Heat Vulnerability Index shows us that 69 of our Census Tracts have moderate-to-very high heat vulnerability. Of those 69 Census Tracts, 58 Census Tracts (or 84%) are within a 1-mile radius of a Cooling Center.