

Written by Allison Homer, Resilient Fairfax Program Manager, and Melanie Malsch, Climate Resilience Specialist
 Here we are in late summer! With kids going back to school and milder temperatures bringing some relief, many of us feel ready for pumpkins, football, and the crisp, cool days of autumn.
Before we let the extreme heat and flash floods of recent months become a distant memory, let’s take a look at the climate trends we experienced this summer. For a good stretch of the summer, extreme heat started to feel like the norm, and we were receiving severe weather alerts on a near-daily basis. Are our summers warmer, wetter, weirder than they used to be? Let’s dive into the data to find out!
It’s Getting Hot in Here
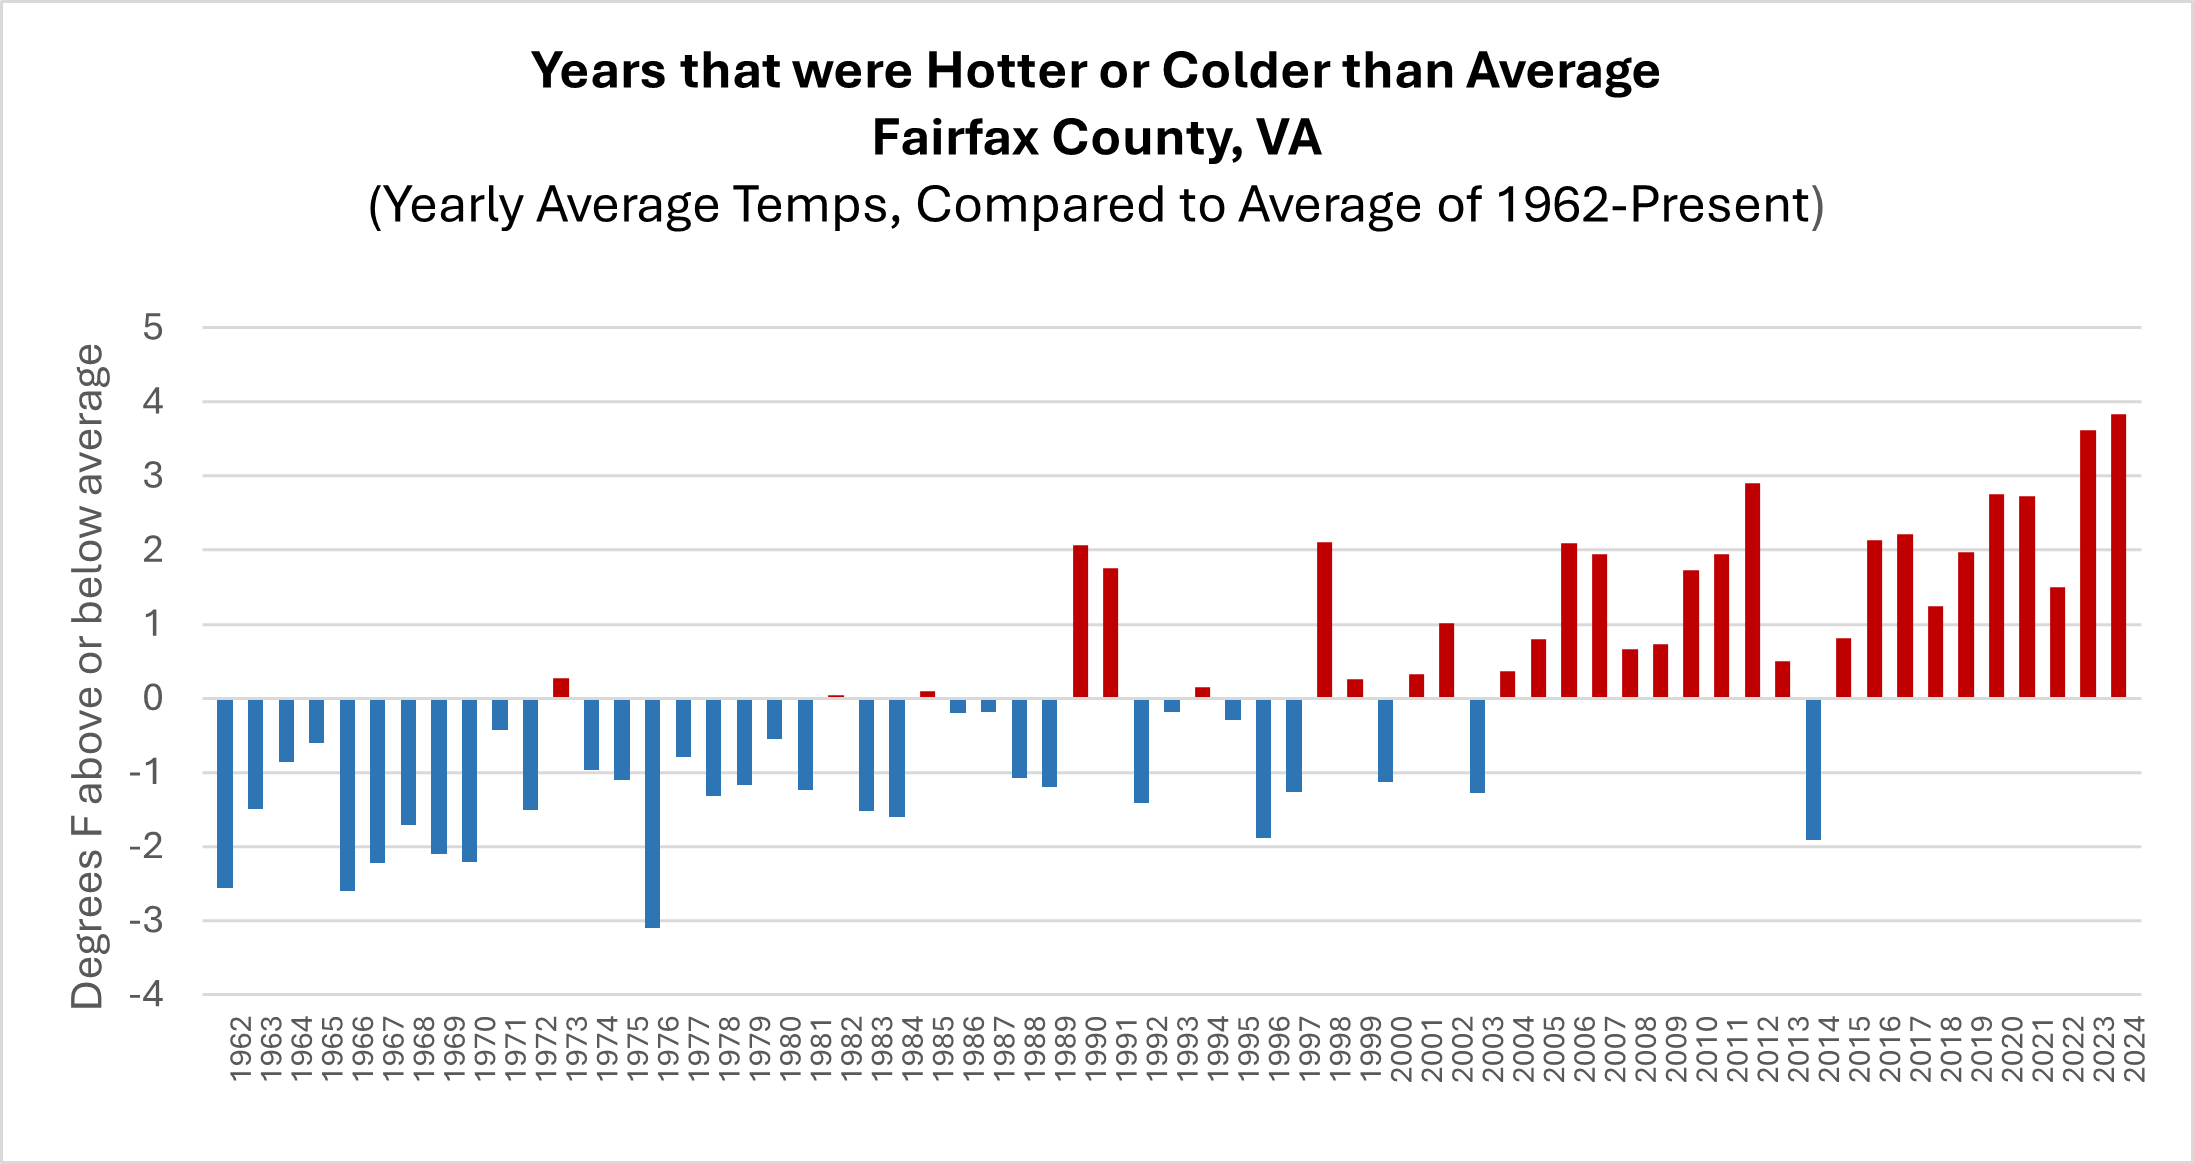
It isn’t your imagination; recent years are indeed hotter than your childhood years. In fact, 19 of the past 20 years have been hotter than average in Fairfax County. (The exception was the randomly cool 2014). The graph below shows how each year’s temperatures since 1962 have compared to the average. Years that were hotter than average are shown in red, above the baseline, and years colder than average are shown in blue, below the baseline. It is hard for us to feel these longer-term warming trends when our day-to-day weather fluctuates. That’s why it is important to keep in mind the difference between weather (short-term trends), and climate (long-term trends of 20 years or longer). For a refresher on the difference between weather and climate, check out this blog post from our colleague.
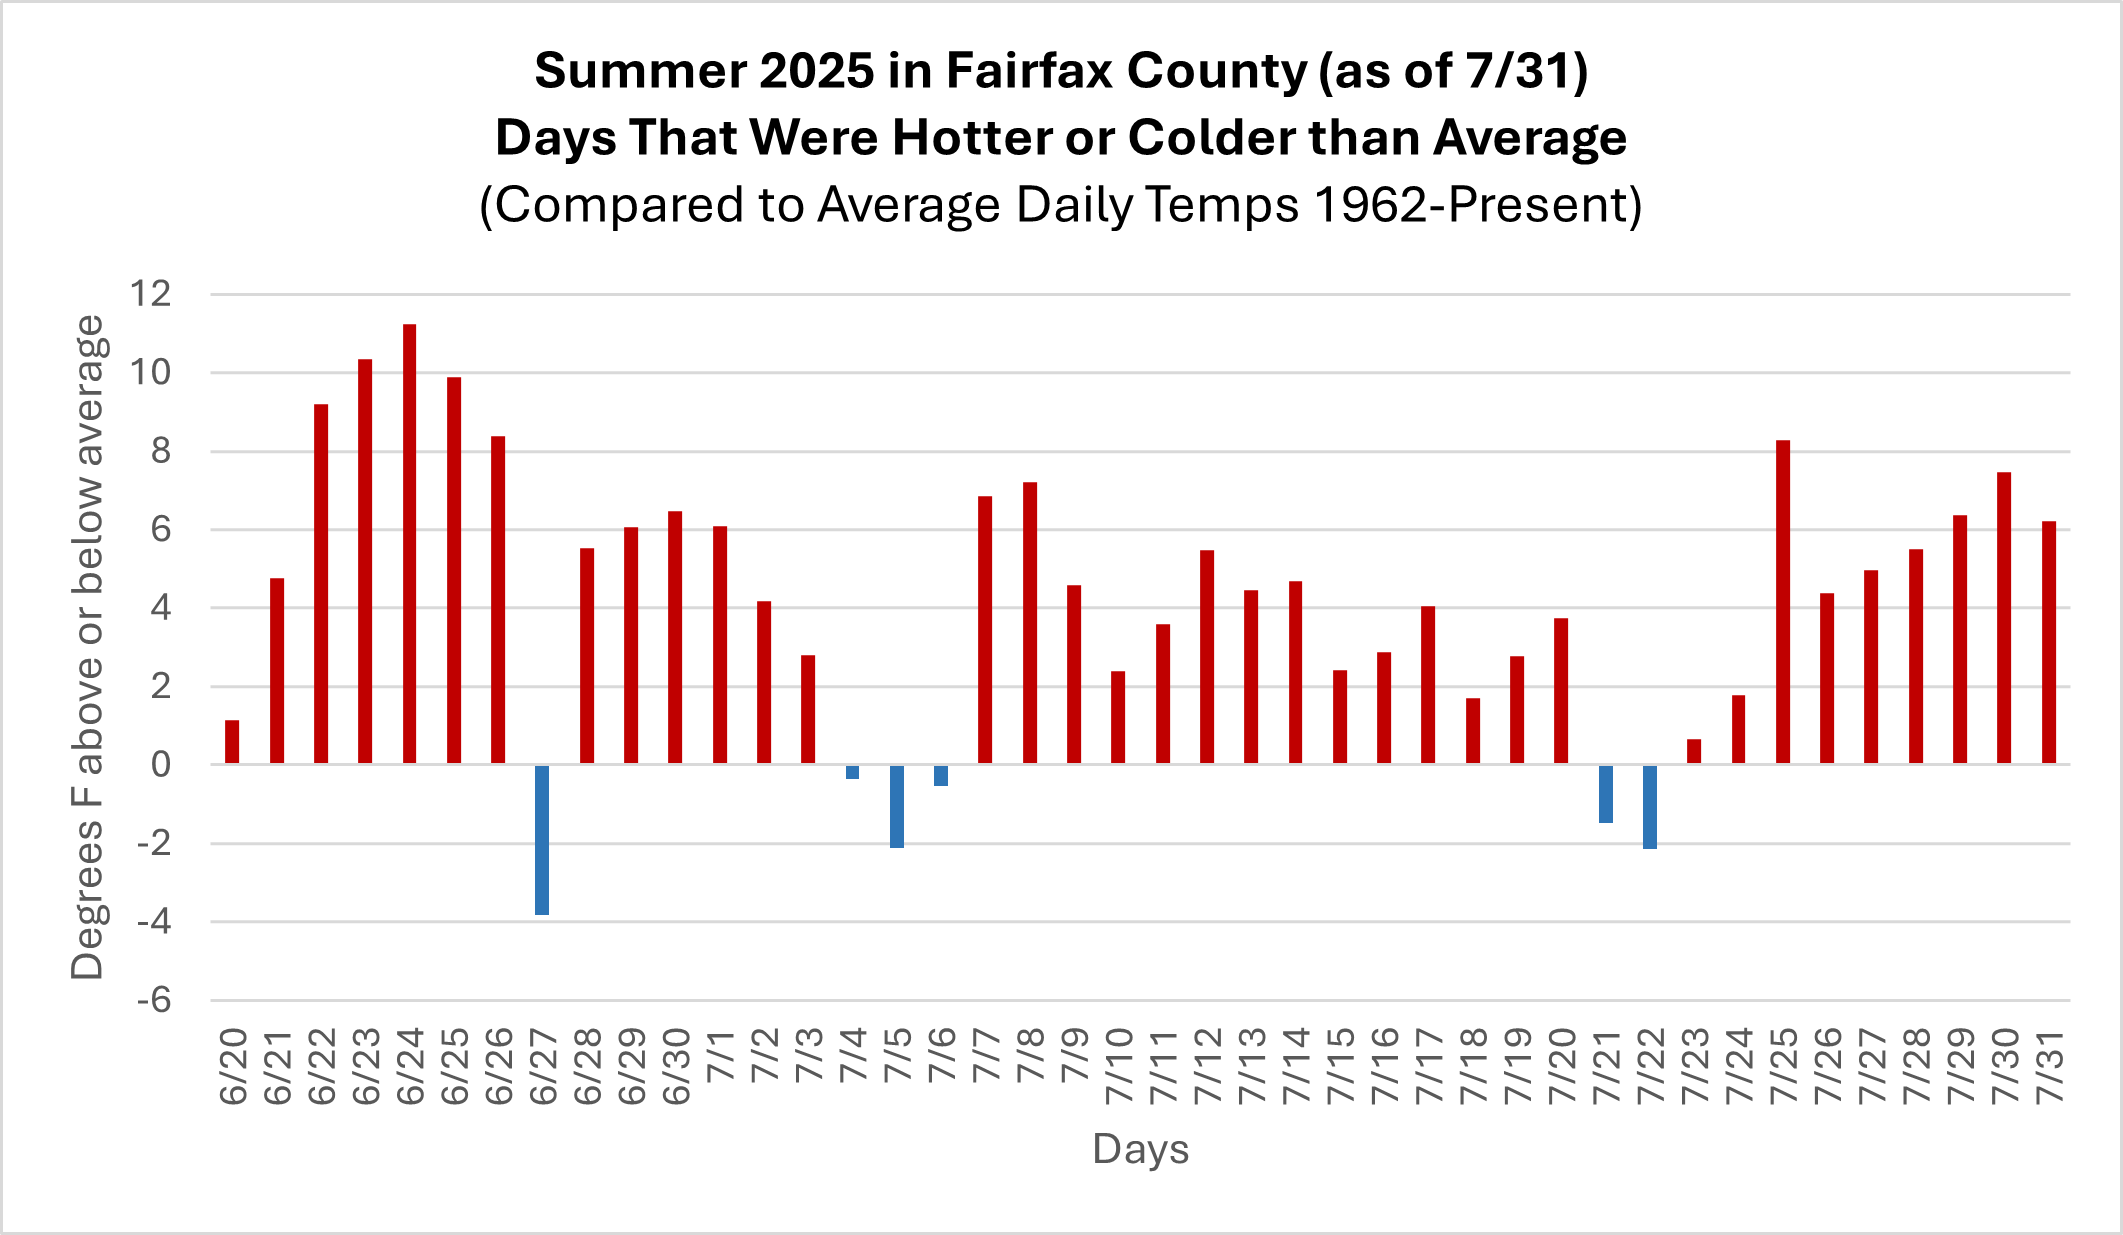
Summer 2025 so far is no exception to the warming trend. Let’s zoom into the specific days we just experienced to see how they compare to average. So far, since the official start of summer on June 20th, most days in Fairfax County have been significantly hotter than normal, even if they haven’t set records.
Baby, It's Warm Outside
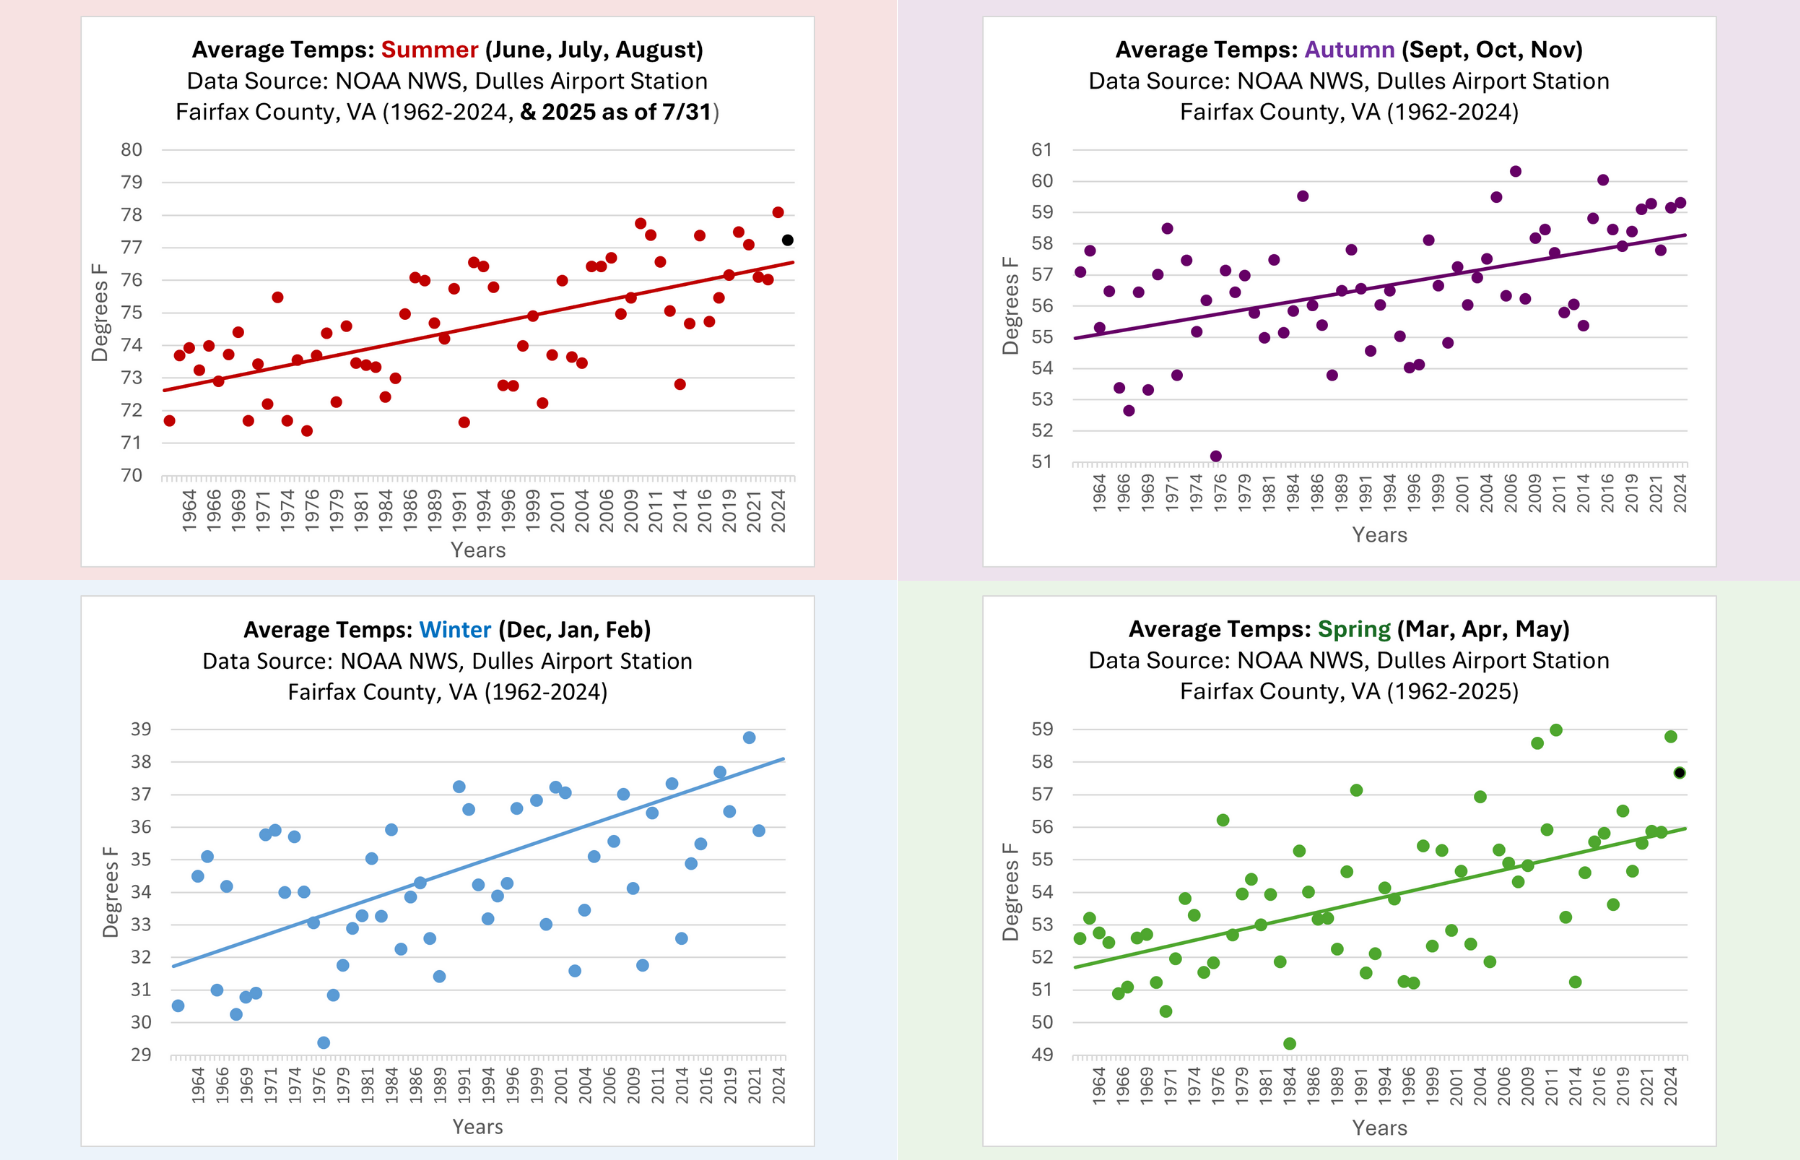
What about summers in general? How have they changed over time? As shown in the graphs below, all seasons are getting warmer, including summer. You may think that because summer is the hottest season, it has seen the biggest increase in temperatures. However, the winter season has actually seen the most drastic increase in temperatures; it just doesn’t get as cold as it used to!
Note: In the “summer” graph below, the dot representing 2025 is shown in black. Because we are only part-way through summer 2025, this dot is subject to change. The graphs below group months by common temperatures, which do not perfectly align with official season dates. For example, the hottest months of the year (labeled as “summer” below) are June, July, and August. However, official summer dates are June 20 to September 22nd.
Summer Days Driftin' Away to those (Hot) Summer Nights
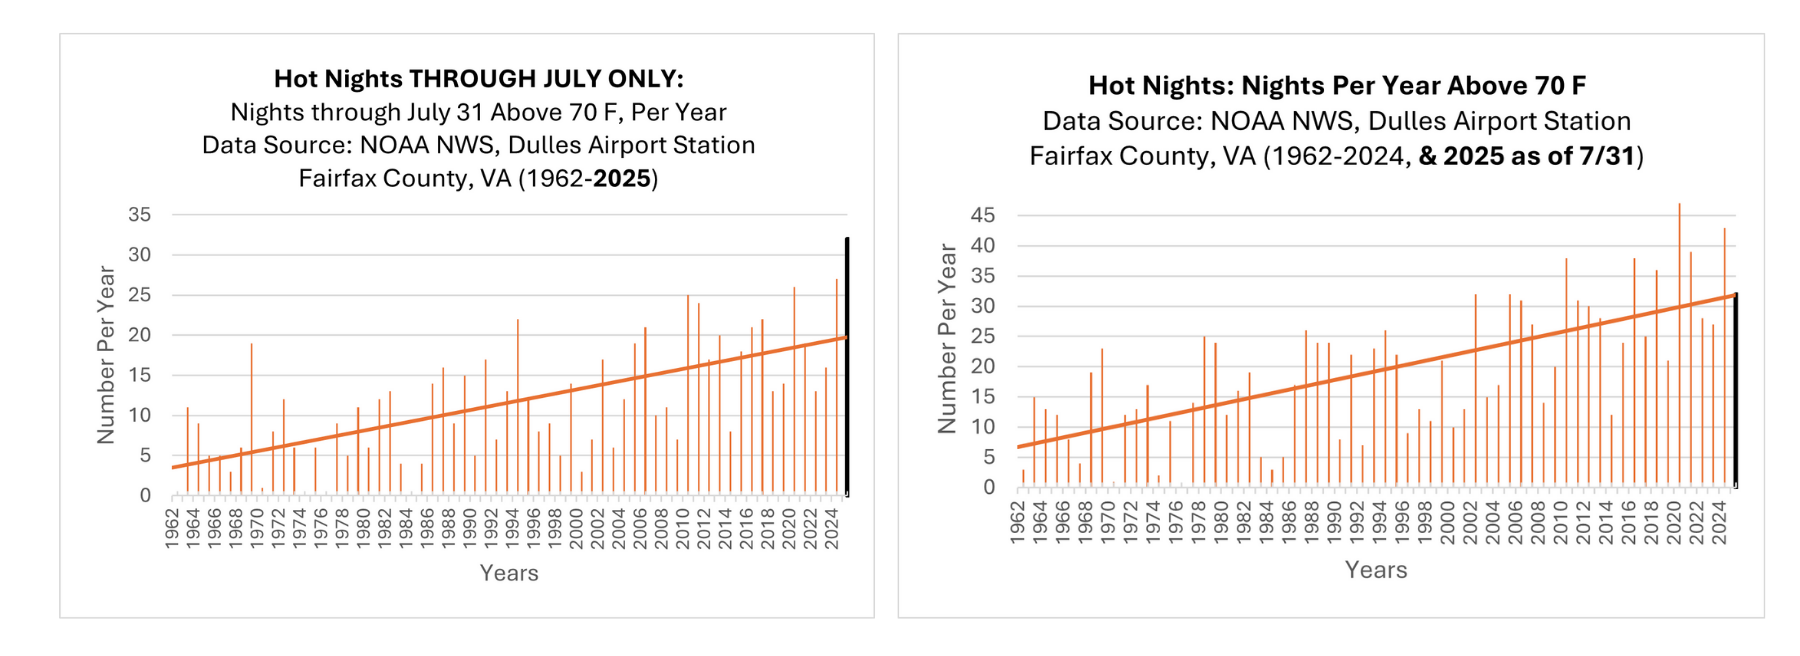
Do you have trouble sleeping when it’s too hot? Many people do! Our nights don’t cool down the way they used to. As can be seen in the graph below, the number of “hot nights” (nights that stay above 70F) per year has drastically increased over recent decades. So far in 2025 (as of July 31), we have already had 32 hot nights. Normally, by the end of July, we’ve only had 12 hot nights.
We are well on pace to meet or surpass last year’s total of 43 hot nights. For comparison, in 1962, there were only 3 hot nights in Fairfax County. This trend is especially concerning for our neighbors who do not have sufficient air conditioning at home, because there is no chance to cool down the house naturally, like opening the windows at night. Living in a home that is dangerously hot can lead to heat-related illnesses and worsen pre-existing cardiovascular issues and other health problems.
(For more temperature trends, including full 2025 data once it is available, please see our Resilience Dashboard!)
What about the floods?
Is it “Raining More Than Ever?”
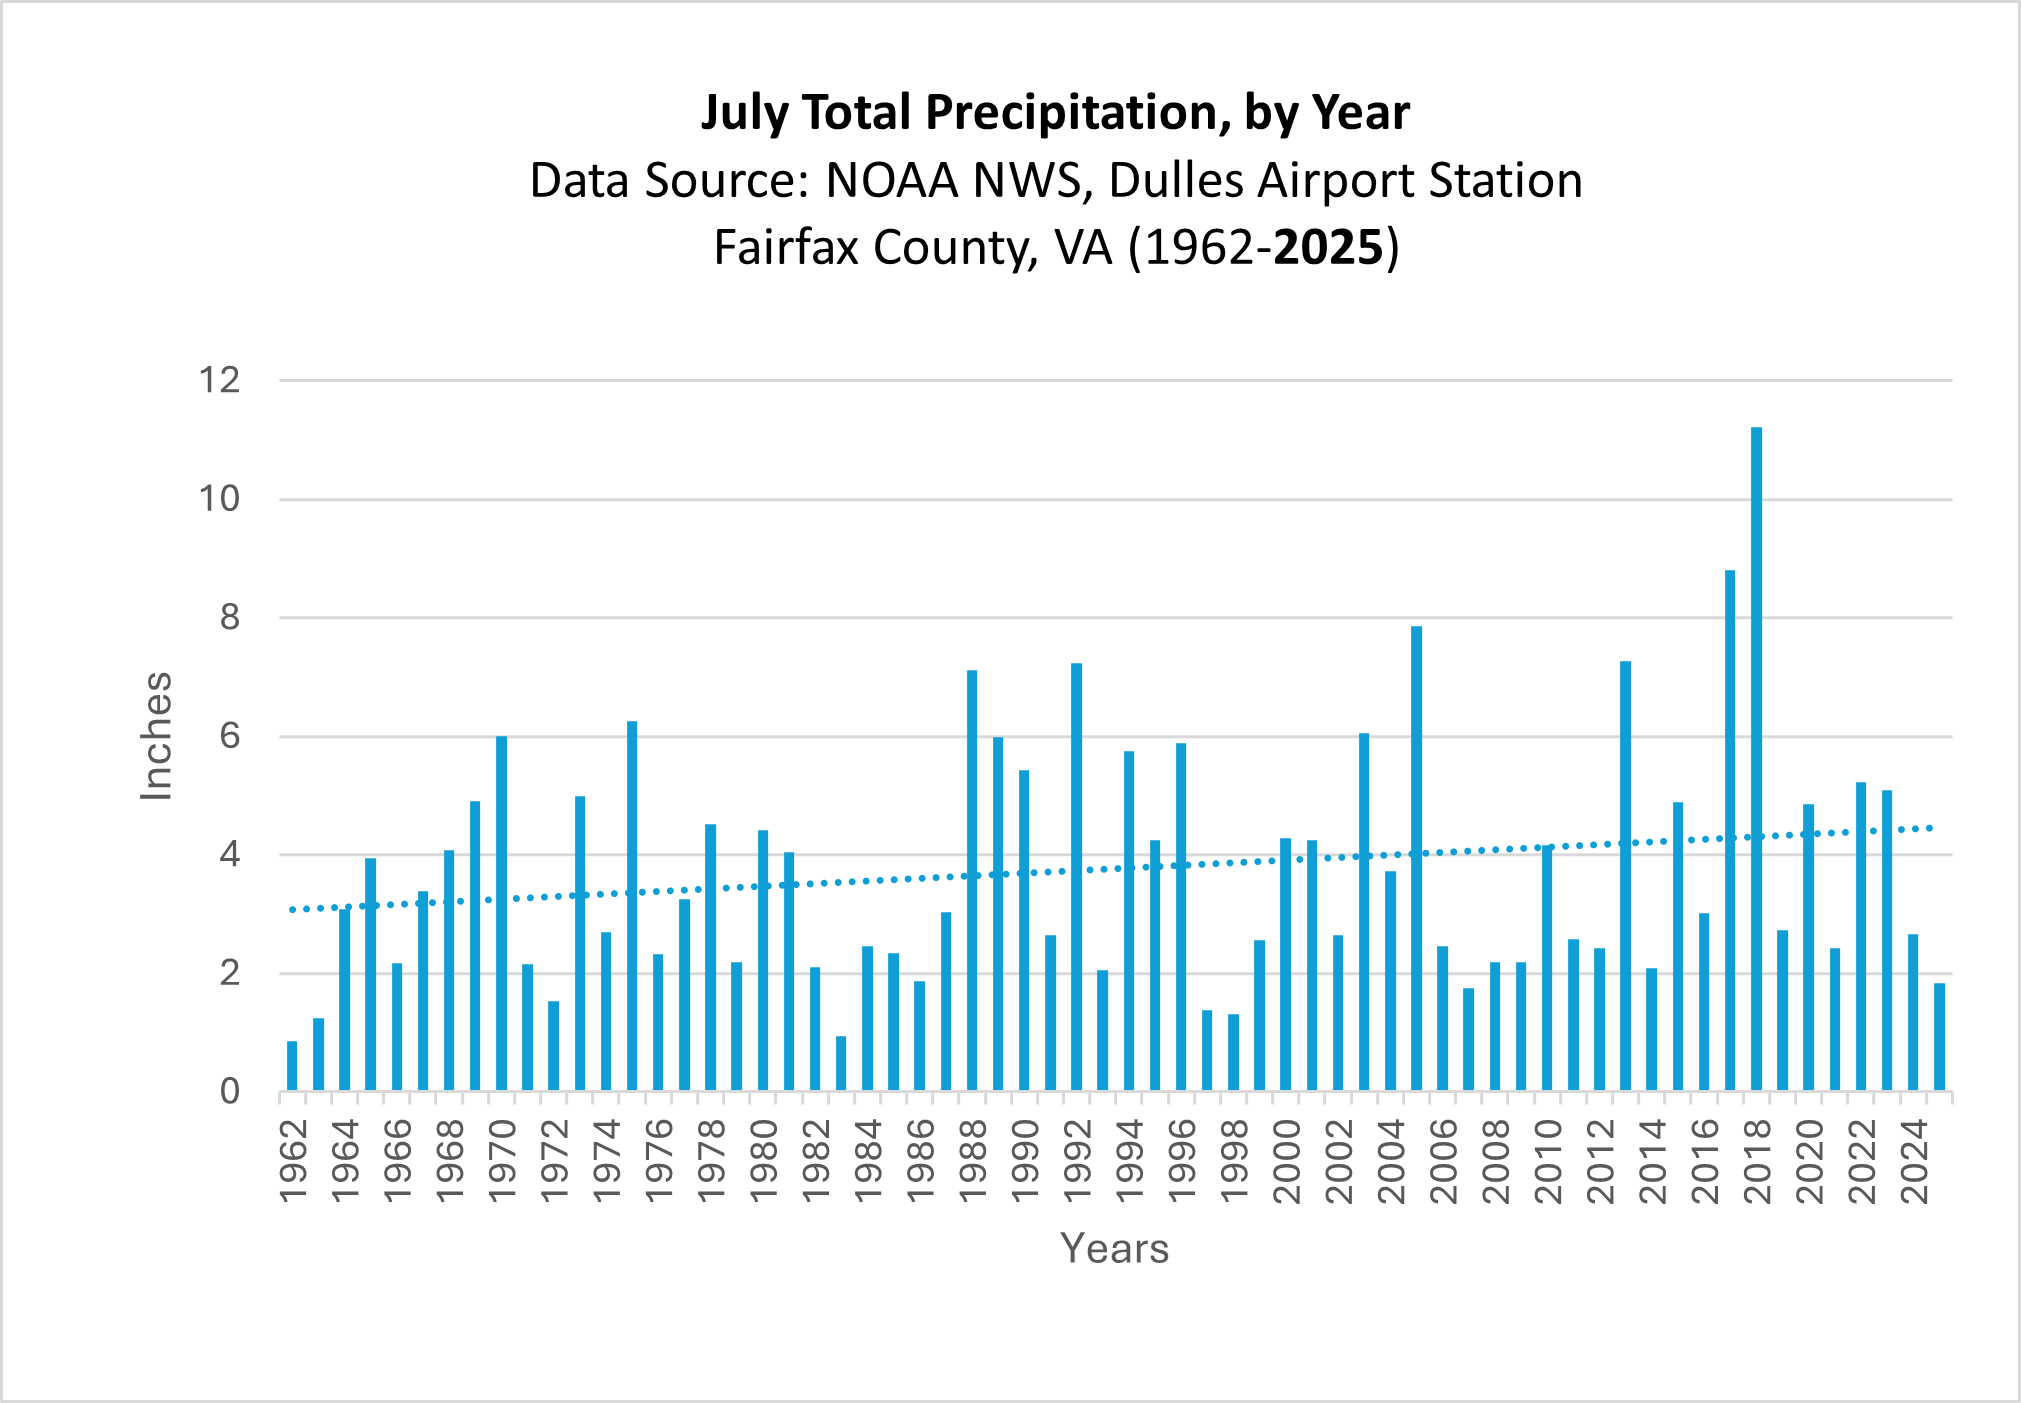
Northern Virginia has been feeling a bit tropical lately with our series of afternoon downpours! You may be wondering: is it raining more than ever? The total amount of rain that we receive each July has increased slightly, and has begun to fluctuate more wildly, as shown in the graph below. However, that is not the full story.
The main thing that has changed over time is the intensity of rain. In Fairfax County, it rains harder than it used to, meaning the same amount of rain falls in shorter bursts of time. If a heavy volume of rain is dumped within a 15-minute or 30-minute time span rather than being gently spread over the course of several hours or days, there is less time for the water to soak into the ground or be transported by storm drains. This causes the ground to become oversaturated and storm drains to be overwhelmed.
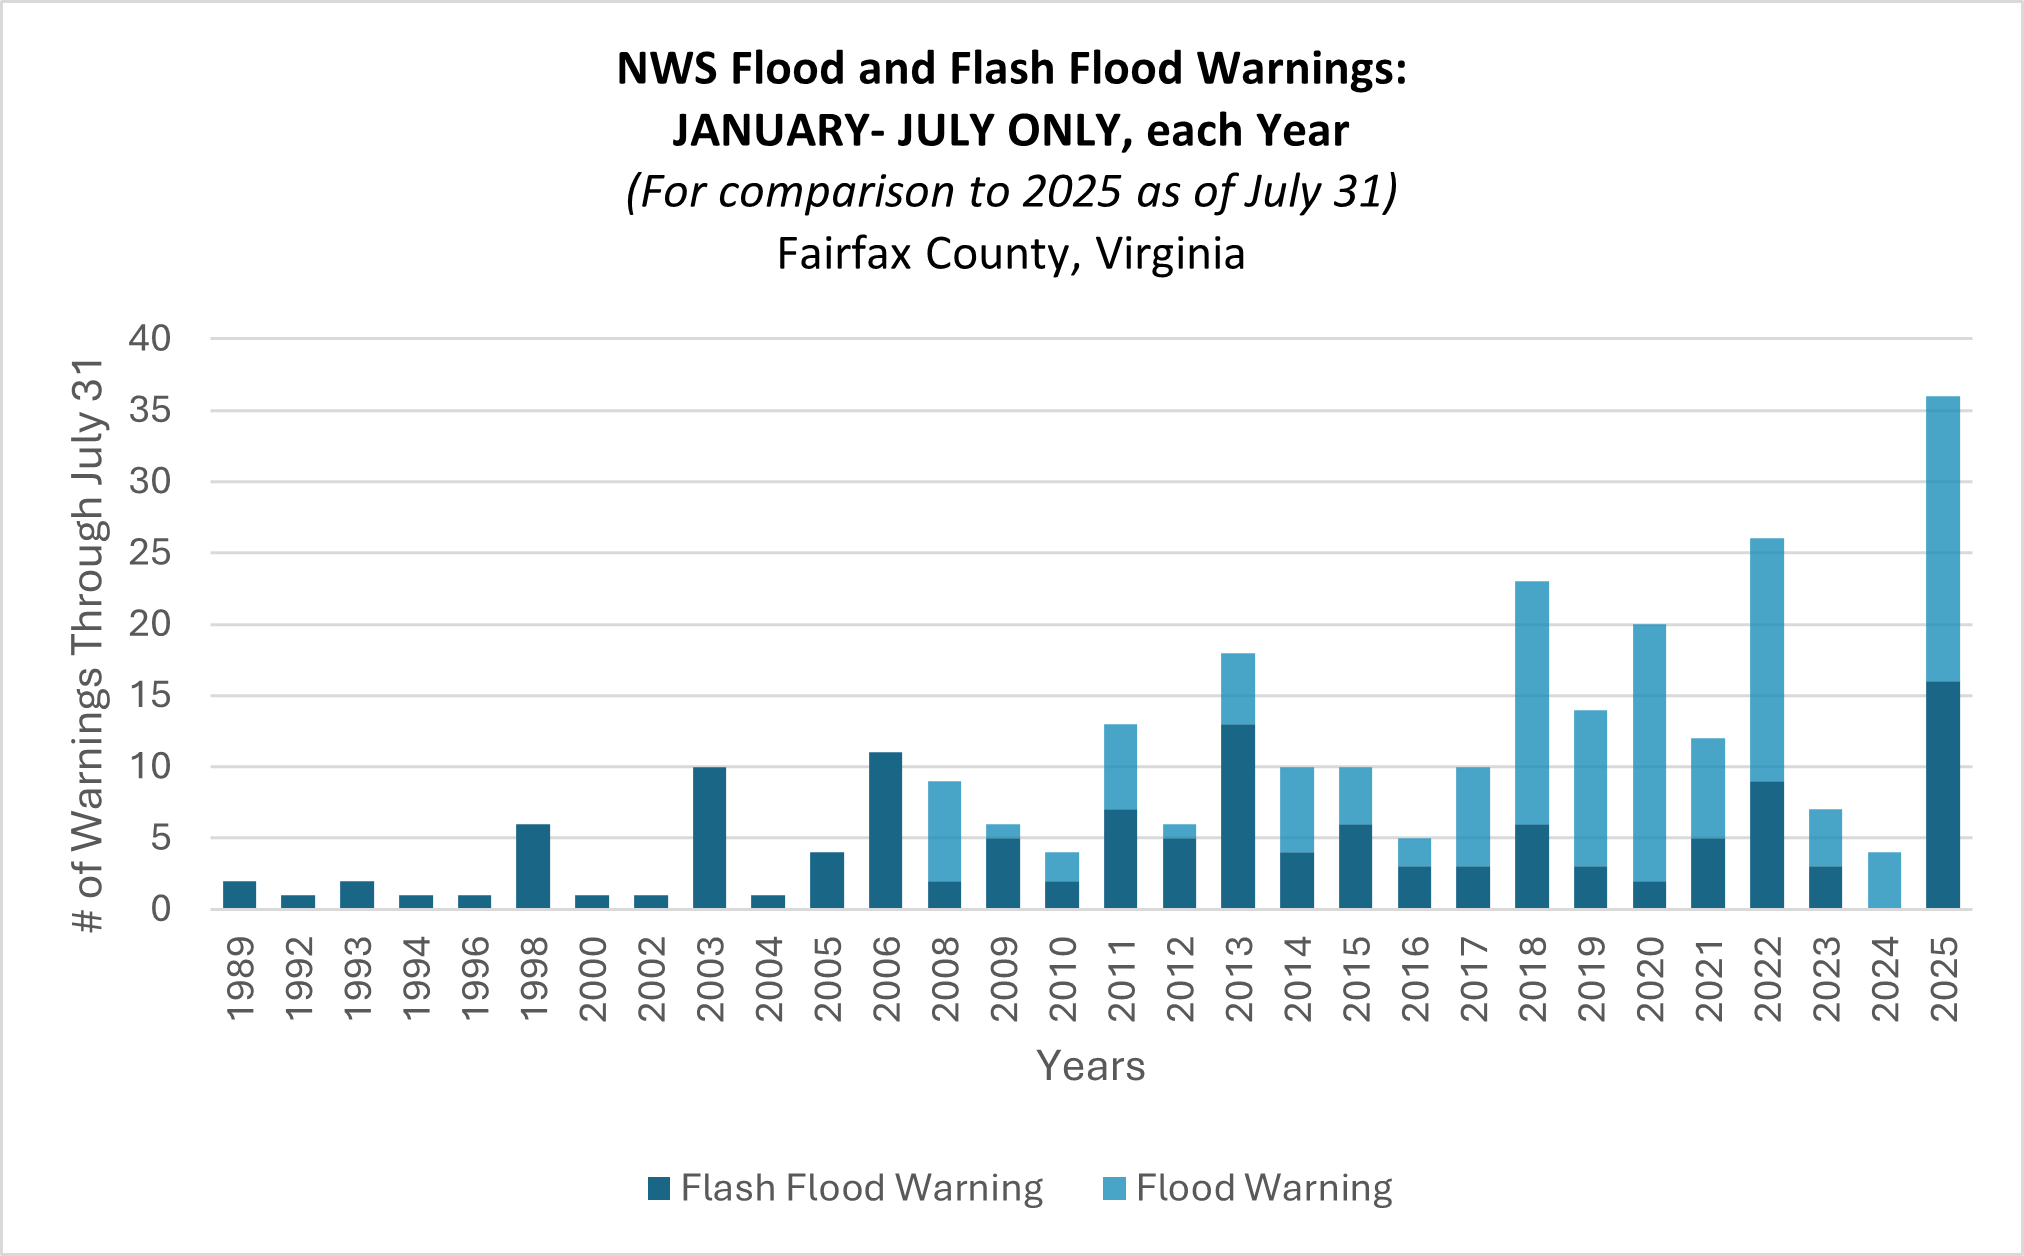
More intense rainfall means more urban flooding and flash flooding. We have seen an increase in such events in Fairfax County, as shown in the graph of flood warnings below. To get an accurate picture of this year so far compared to past years, the first graph below compares warnings issued only during the first seven months of each year. This year, as of July 31, the National Weather Service (NWS) has issued 16 flash flood warnings and 20 flood warnings. As you can see — 2025 has far outpaced past years by this time, surpassing the previous highest year (2022) by 10 alerts!
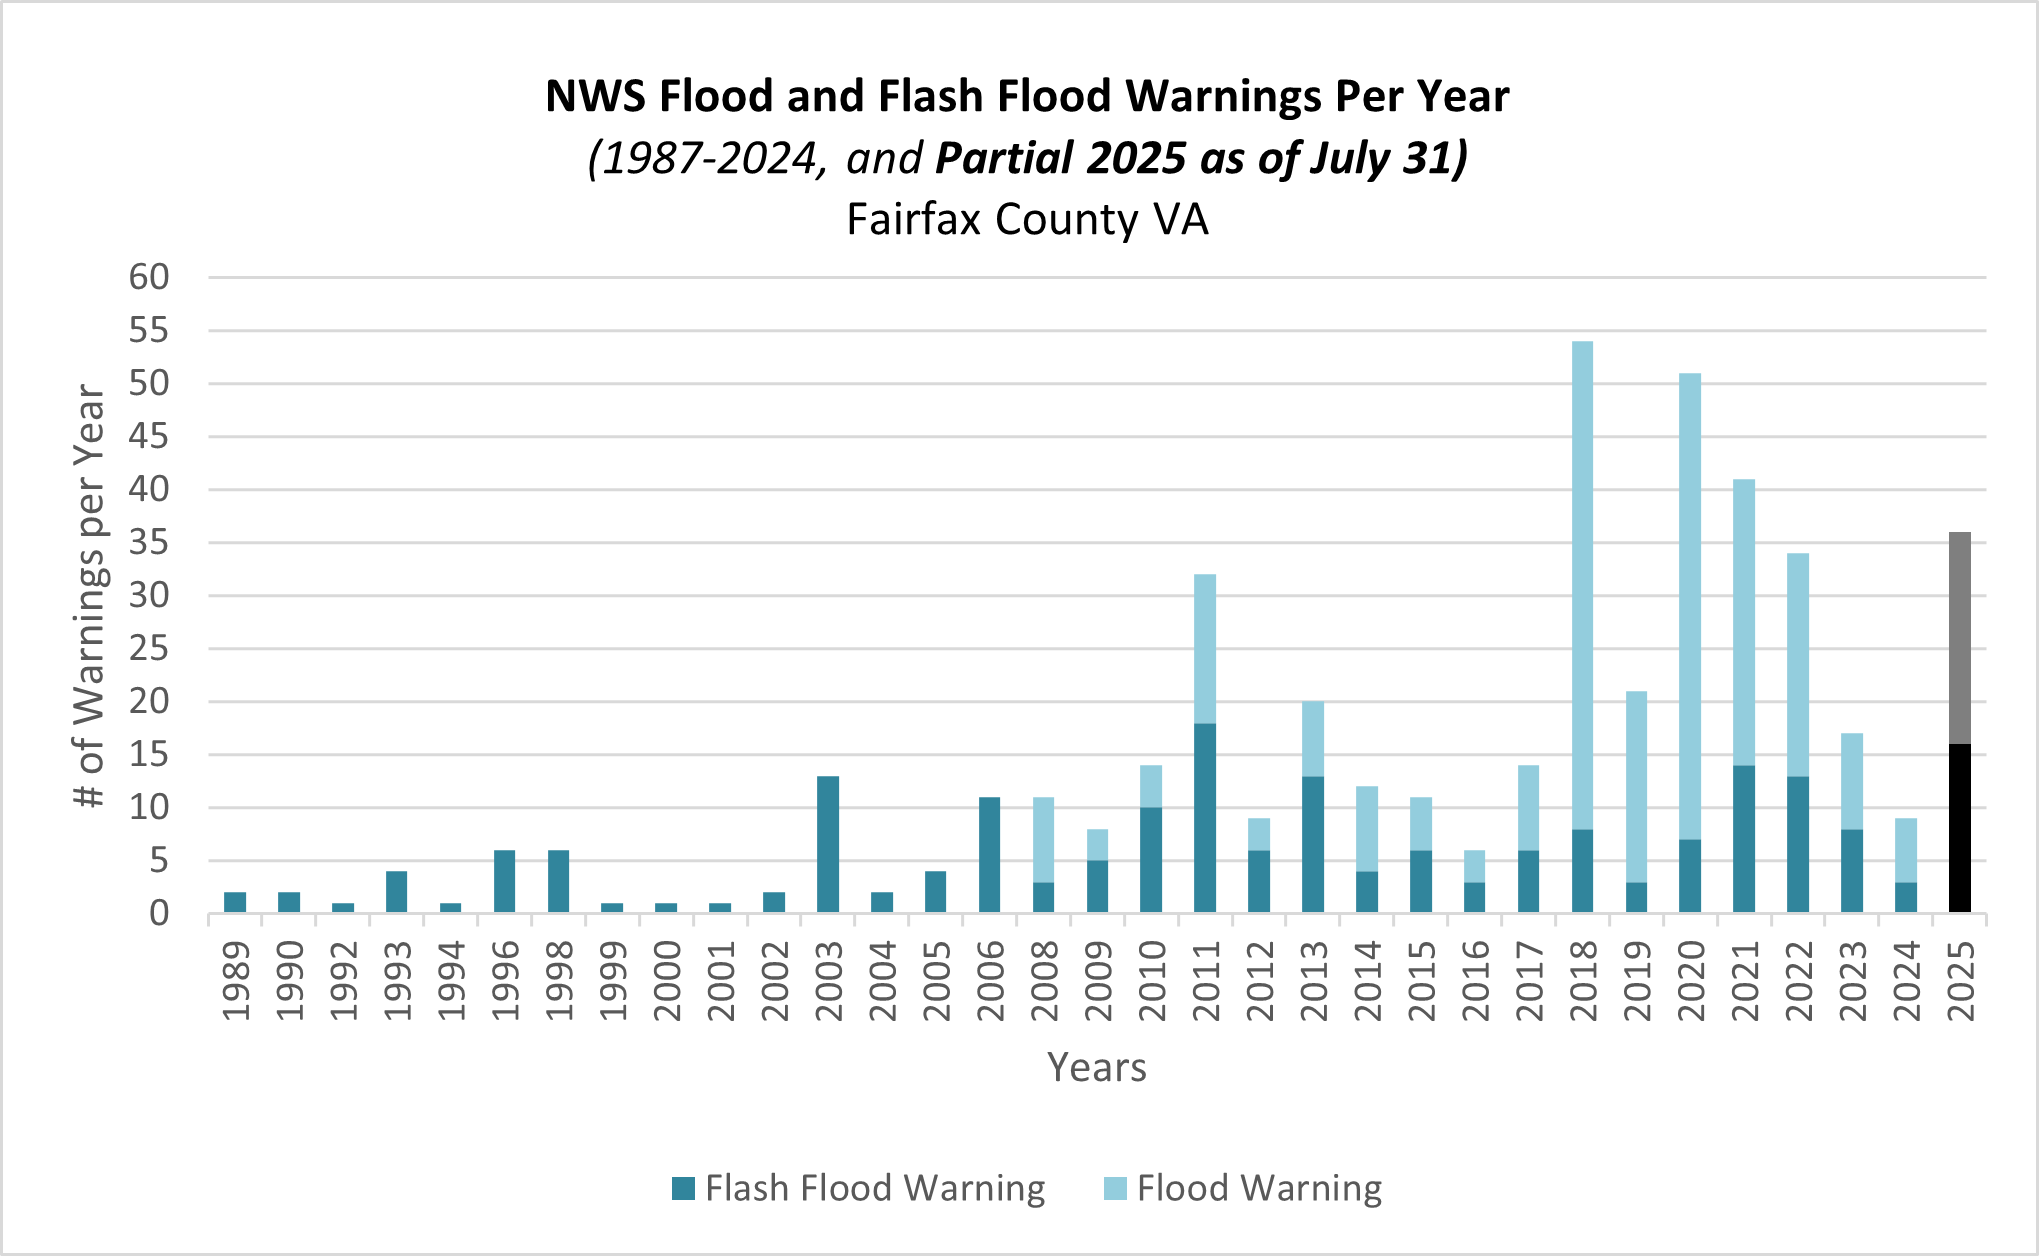
For a view of flood alerts across all months of each year, please see the graph below. Note: 2025 (shown in black and grey) is only halfway complete.
You may be wondering how these warnings translate to storms themselves. The National Oceanic Atmospheric Administration National Centers for Environmental Information (NOAA NCEI) database tracks the results of storms, or storms that had sufficient intensity to cause loss of life, injuries, significant property damage, and/or disruption to commerce. As can be seen in the graph below, there has been a notable increase in severe storms over time in Fairfax County. The flooding-related storm events can be seen in blue. While there is quite a bit of variation year-to-year, the long-term trend of increasing rain intensity means that in general, we are likely to continue experiencing more severe storms, flooding, and flash flooding in future summers.
Note: We know from our daily experiences and the NWS flood warnings that 2025 has been an exceptionally high year for storms. However, data in the NOAA NCEI database has not been updated in recent months, so 2025 storm data are unfortunately unavailable for the chart below.
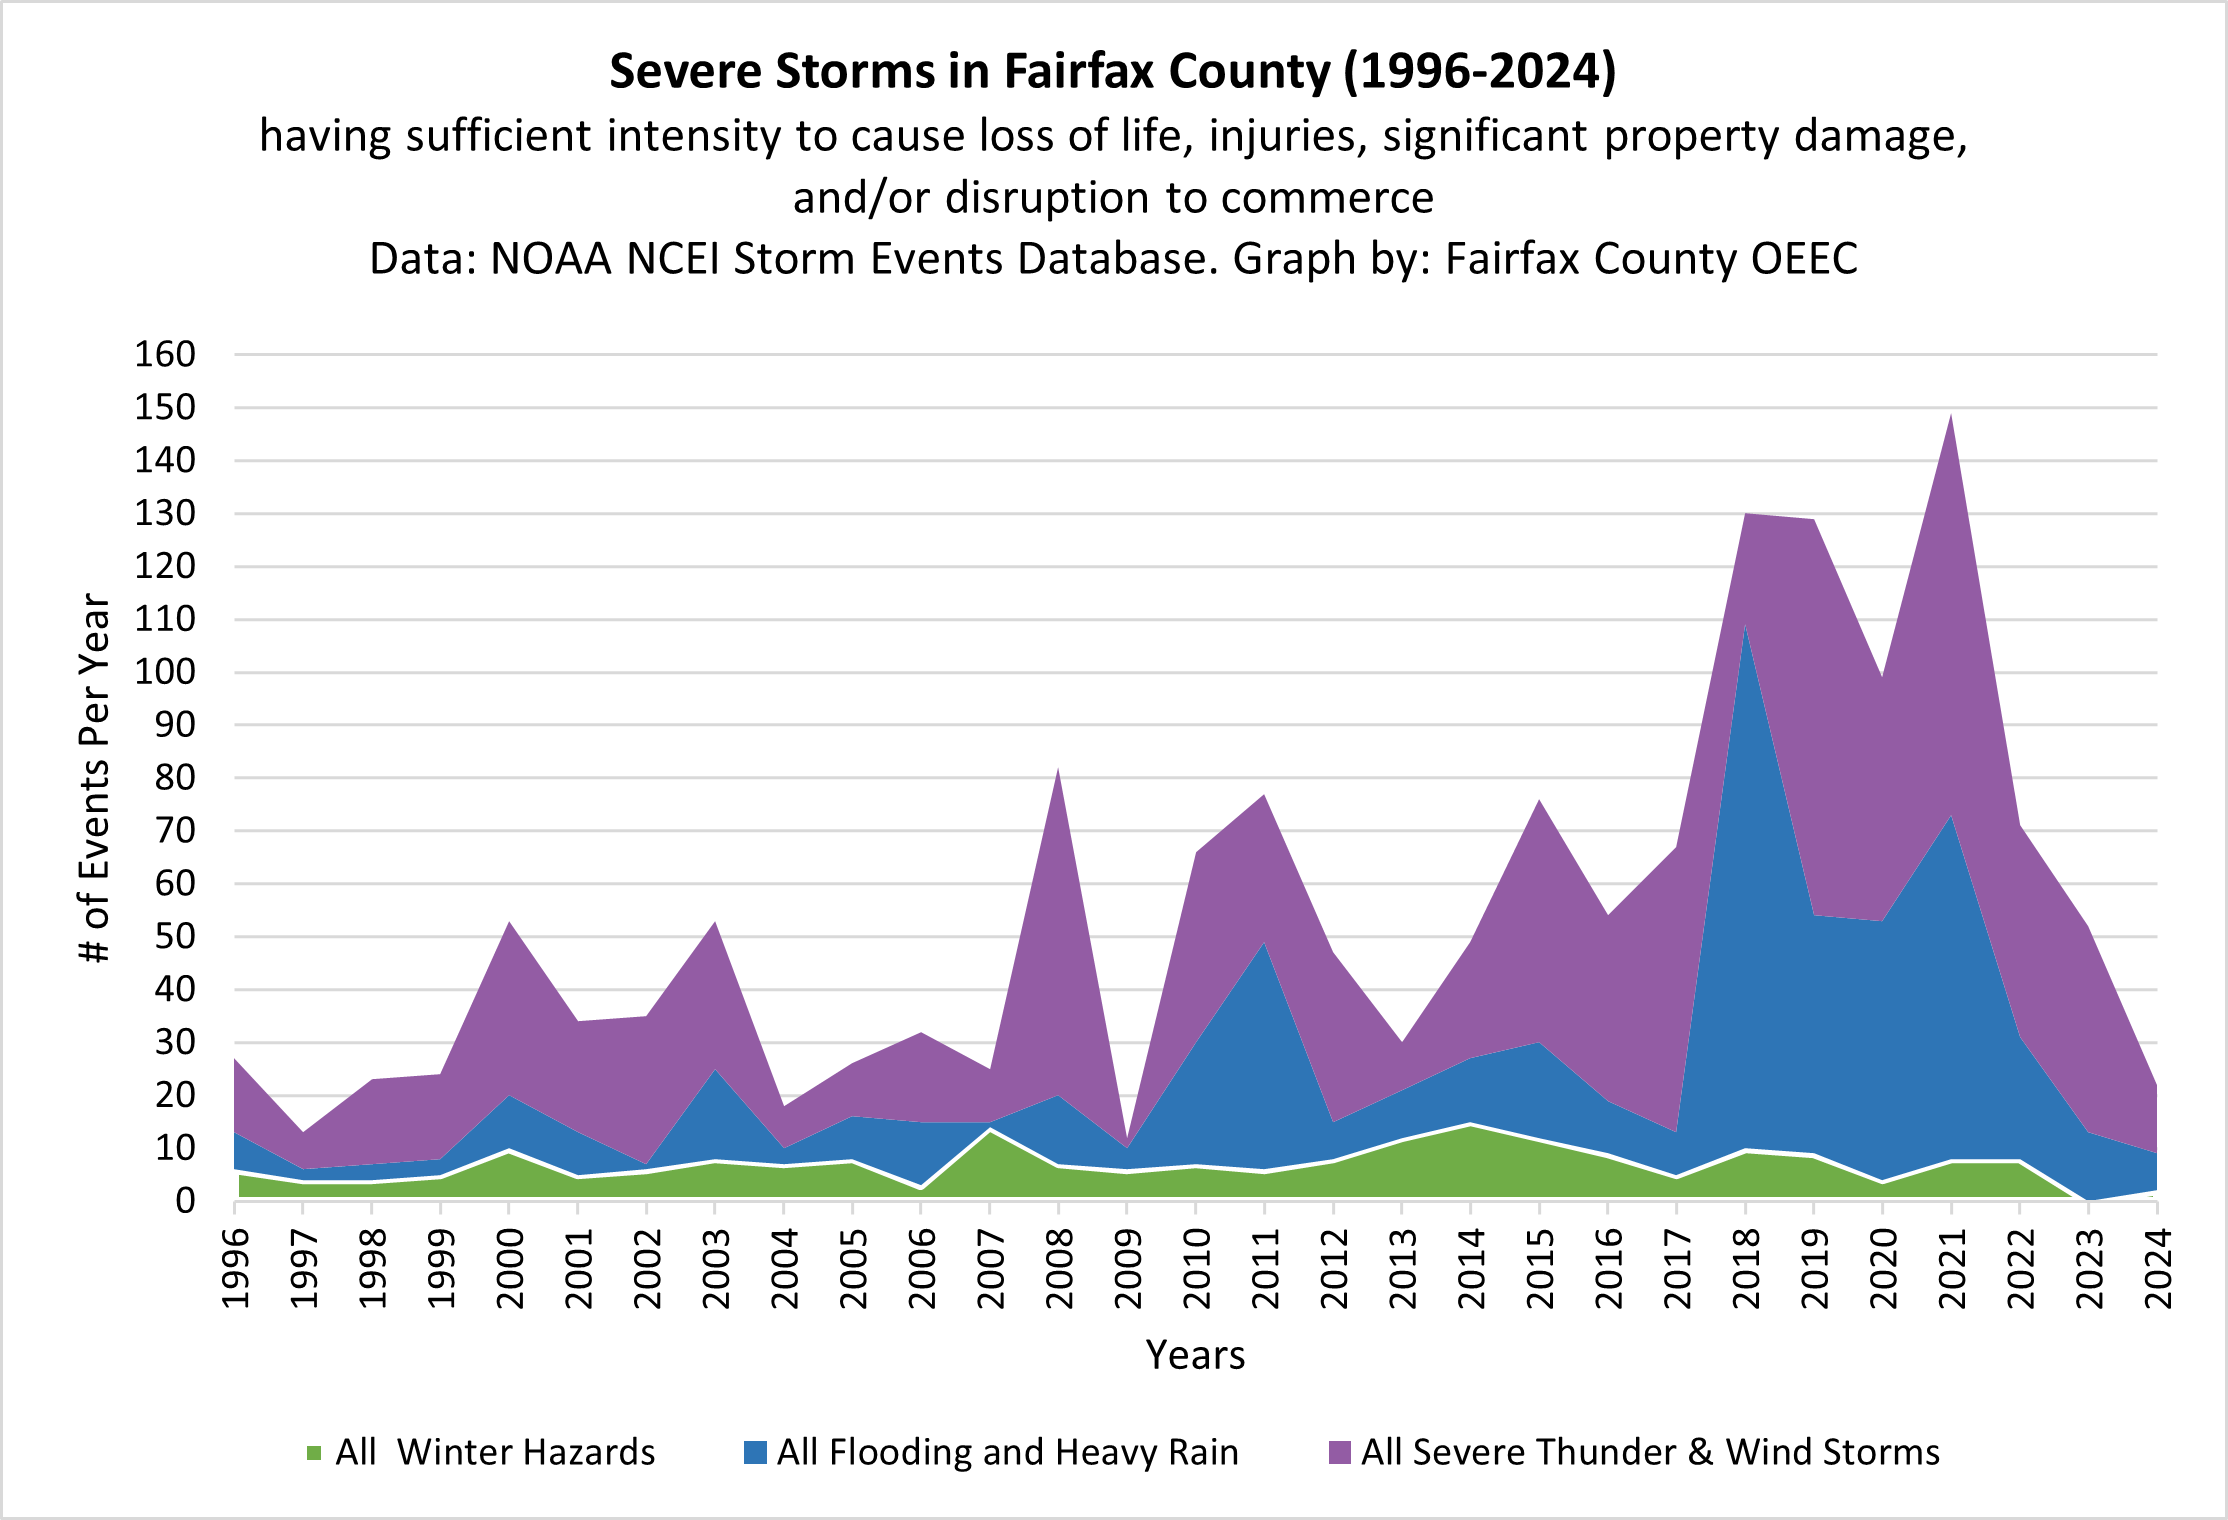
(Note: this graph provides data available from 1996 through 2024. 1996 is the start date instead of 1962 because NOAA methodology for storm event logging was updated in 1996. Data after February 16th, 2025 are unavailable at this time.)
Our tagline for Resilient Fairfax is “warmer, wetter, weirder,” and that has certainly been the case this summer.
Between heat waves, flooding in our own backyards, and coverage on the news of cars trying to navigate inundated roads, it certainly feels like extreme weather is top of mind this summer. While this can feel worrying, you’ve taken the right step seeking to understand the data trends!
What Can We Do?
The good news is that Fairfax County is adapting and becoming more resilient to extreme heat and flooding. In alignment with the Resilient Fairfax plan, dozens of county departments are working to connect residents to:
- cooling programs,
- Cooling Centers,
- extreme heat resources,
- flooding information,
- flood-proofing programs like:
- flooding and drainage service request systems,
- tree planting programs,
- and more!
To learn more, visit the Resilient Fairfax webpage or email ResilientFairfax@fairfaxcounty.gov.
In addition to handling the local effects of climate change, we can do our part in the global effort to address the root cause of climate change by reducing greenhouse gas emissions. In alignment with the county’s emission reduction plans we are reducing greenhouse gases from our cars, energy use, waste, and more. For more information, please see Climate Plans, Policies and Initiatives.
 Allison Homer is the Resilient Fairfax Program Manager and a climate planner for the Office of Environmental and Energy Coordination. In her role, she coordinates with staff from 25+ county agencies to help the county create climate-ready communities, resilient infrastructure and buildings, and adaptive environments. She holds an environmental Master of Urban and Regional Planning (MURP) degree, a Global Master of Natural Resources (GMNR) degree, and a Graduate Certificate in Global Sustainability from Virginia Tech, in addition to a Bachelor’s degree from Wake Forest University. She is certified by the American Institute of Certified Planners (AICP) and a LEED Accredited Professional for Neighborhood Development (LEED AP ND).

Melanie Malsch is a Climate Resilience Specialist for the Office of Environmental and Energy Coordination. She helps implement the county’s Resilient Fairfax plan to build community resilience to extreme heat, flooding, and severe storms. Melanie holds a degree in Environmental Studies from the University of Pittsburgh.
Climate Matters is the blog of Fairfax County’s Office of Environmental and Energy Coordination, where we share stories, insights and information related to climate change and environmental sustainability. Posts are written by knowledgeable and passionate OEEC staff members and guest authors. To read all blog posts, visit Climate Matters.