

In 2007, the County made an agreement with the U.S. Geological Survey (USGS) to create and run a Water Resources Monitoring Network. This network collects data on streamflow and water quality. This partnership is a long-term effort to track conditions over time and see how new stormwater projects improve the watersheds. Most of these projects are required to help improve the health of the Chesapeake Bay – by reducing nitrogen, phosphorous and sediments in our waterways.
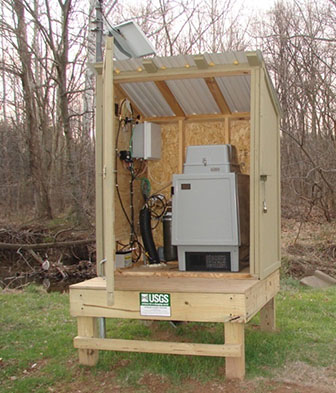
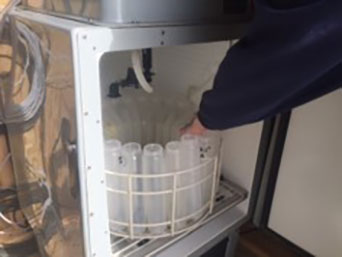
The original network had 14 stations: 4 “intensive” monitoring sites and 10 less-intensive “trend” sites. The intensive sites have equipment that continuously monitors water quality, stream height, and collects water samples during storms (when most pollutants move through the watershed). These sites send data to a USGS data center, where many of the measurements can be seen in near real-time on the USGS Fairfax Project Page. A picture of an intensive monitoring station is shown below. These intensive sites also have cameras for time-lapse viewing of stream conditions - via the web.
The network’s “trend” sites are visited monthly to collect streamflow and water quality data. These stations help us understand conditions throughout the County in a more cost-effective way. This network was designed to use both the “intensive” and “trend” stream gages to give us a detailed view of pollutants and stream conditions and allow us to track changes in these conditions over time.
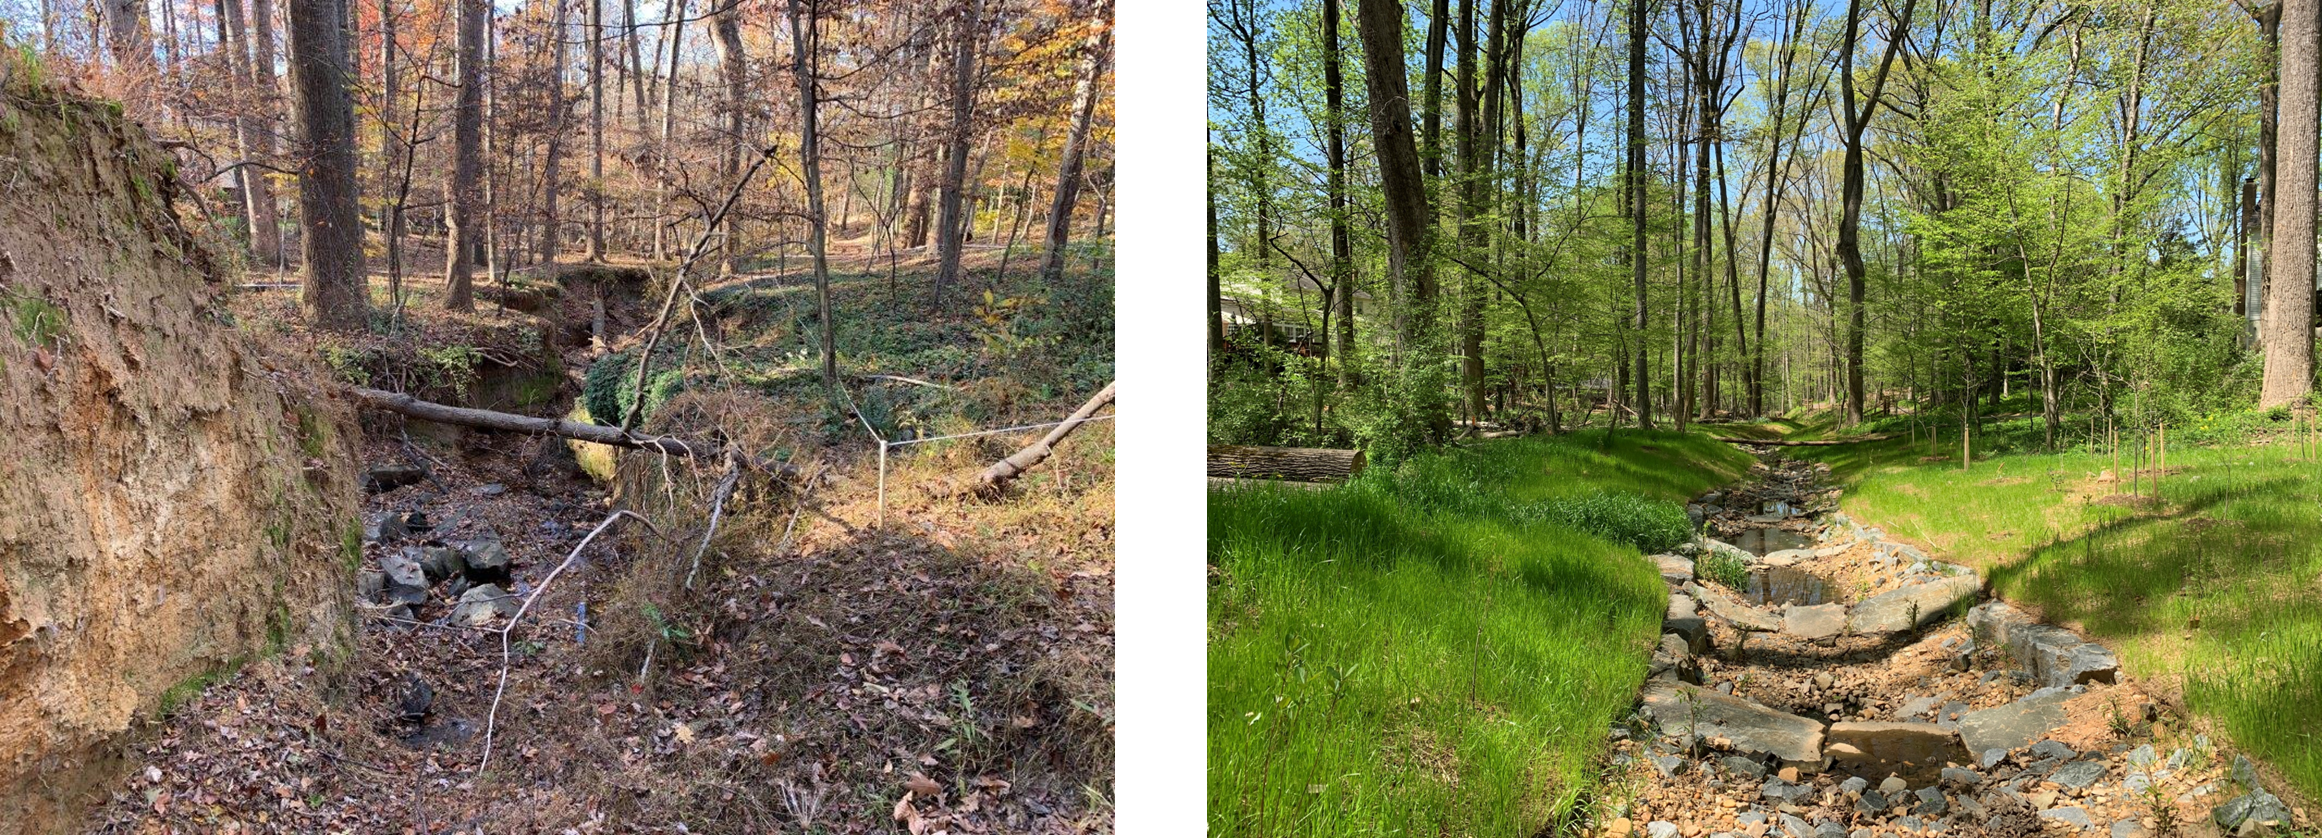
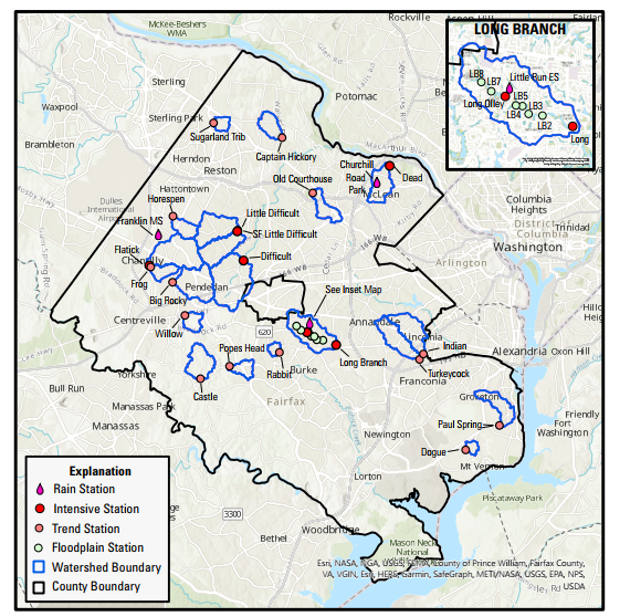
In 2012, the network was expanded and six more monitoring stations were added. An additional station was installed in 2022. Now, there are 21 stations in Fairfax County (six intensive + fifteen trend), plus three new rain gages to measure rainfall. These new stations help cover more areas of the county and collect more information in the Long Branch sub-watershed of Accotink Creek. This stream has too much sediment and salt, which makes the water quality poor and hard for diverse aquatic life to thrive. Because of this, the county is required to reduce the salt and sediments in the stream. The county is planning and working on a large suite of projects to reduce this pollution, and the monitoring network will help check how well the projects are working. A map of all the network stations and their drainage areas is shown below. This includes some smaller stations set up along Long Branch to measure what is happening in the stream’s floodplain.
In 2024, the County and USGS added another gage (intensive monitoring station) below Lake Accotink to study sediment build-up in the lake. While that study is separate from this Countywide Water Resources Monitoring Network, you can find more information about the Lake Accotink study at: Lake Accotink Sedimentation Study | U.S. Geological Survey.
Over the course of this work, three Scientific Investigation Reports (SIR) have been published, which present results and analyses of this long-term study. Findings from the most recent SIR (2023) are summarized in an interactive Geo-narrative story map: How and why are conditions changing in Fairfax Streams?, which can be found on the USGS’s Project Page – along with the most recently published journal articles (2025, 2026) evaluating the data being generated by this network.
For more information about the goals of the Countywide Network and the Long Branch special study, as well as interactive maps, data tools, publications, and all related data, please visit the Fairfax County Water Resources Monitoring Network Project page hosted by USGS.