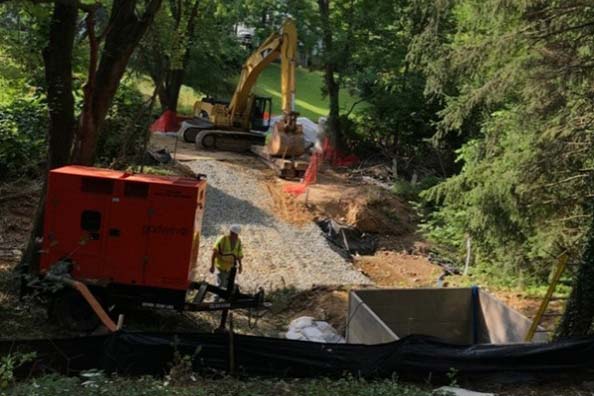
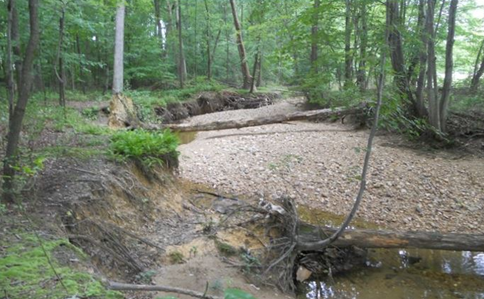
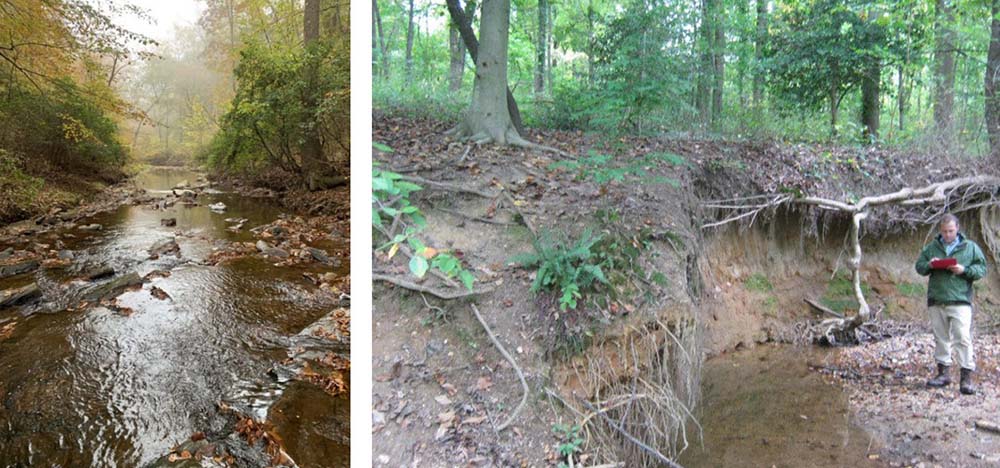
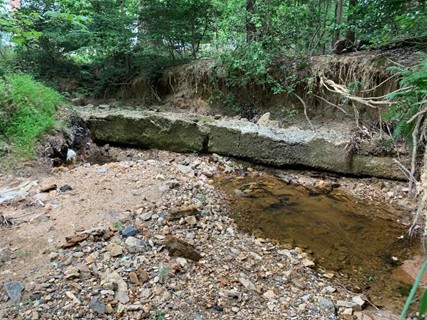
Clean water is important for healthy ecosystems and a sustainable environment. Human actions impact the County’s streams, lakes, wetlands, rivers, and the lands that drain them. These are called watersheds.
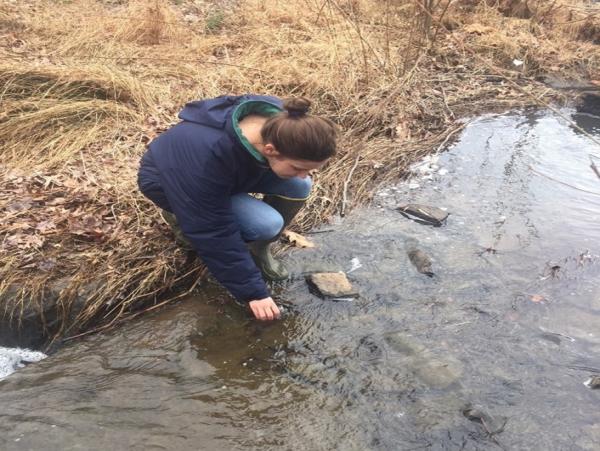
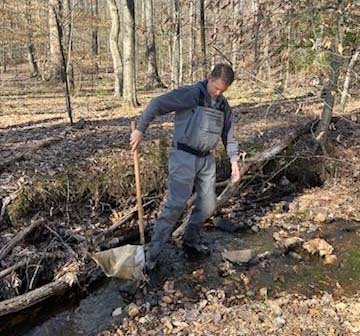
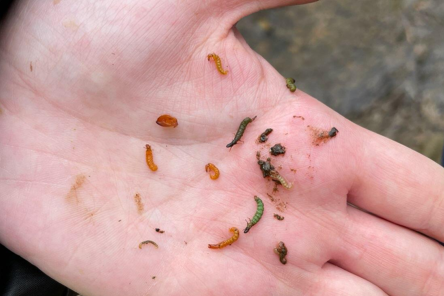
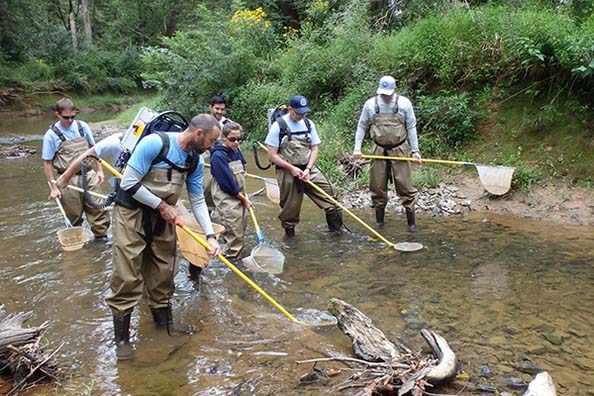
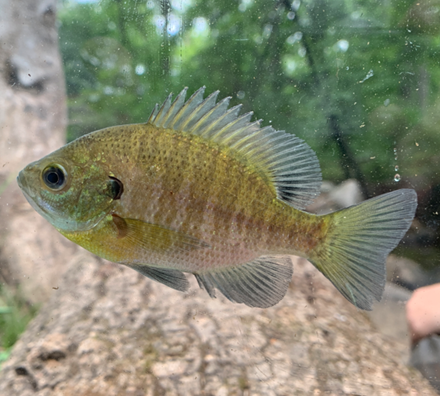
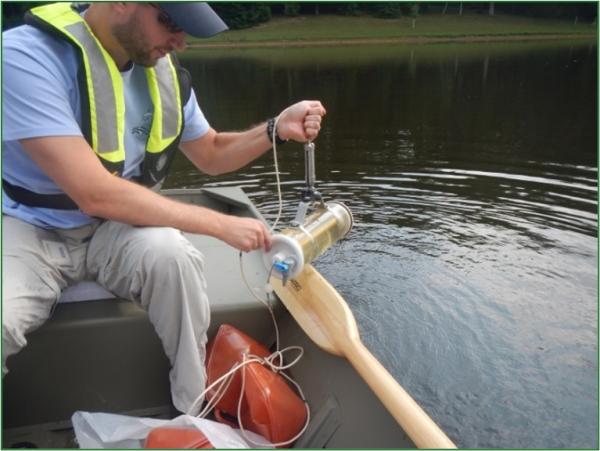
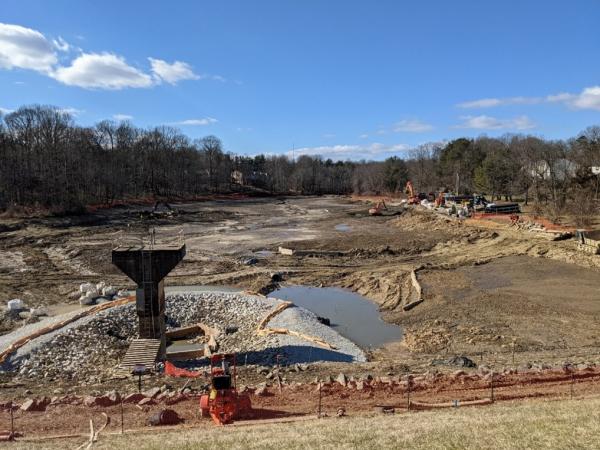
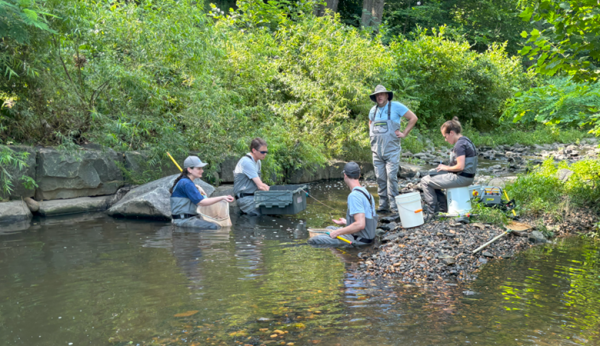
Fairfax County studies stream health by monitoring living and non-living parts of our freshwater ecosystems. This information helps assess the condition of our watersheds and guides efforts to protect and care for our local freshwater resources. Environmental monitoring of our watersheds is required by state and federal laws and supports Fairfax County’s environmental goals.
Learn more about how Fairfax County measures the health of our streams and lakes.