Testing for Radon
Radon is measured in picoCuries per liter of air (pCi/L), a measurement of radioactivity. The U.S. Environmental Protection Agency (EPA) recommends fixing homes that have levels at or above 4pCi/L. It is estimated that 1 in every 15 U.S. homes has radon levels greater than 4 pCi/L.
Testing is simple and inexpensive. Kits can be purchased at hardware and home improvement stores. You also can hire a qualified tester to do a radon test for you. If your test results exceed 4pCi/L , a mitigation system should be installed to remove the radon gas from beneath your home.
For more information on radon testing and mitigation, and to get a coupon toward the purchase of a home test kit, visit the VDH's Indoor Radon Program web page.
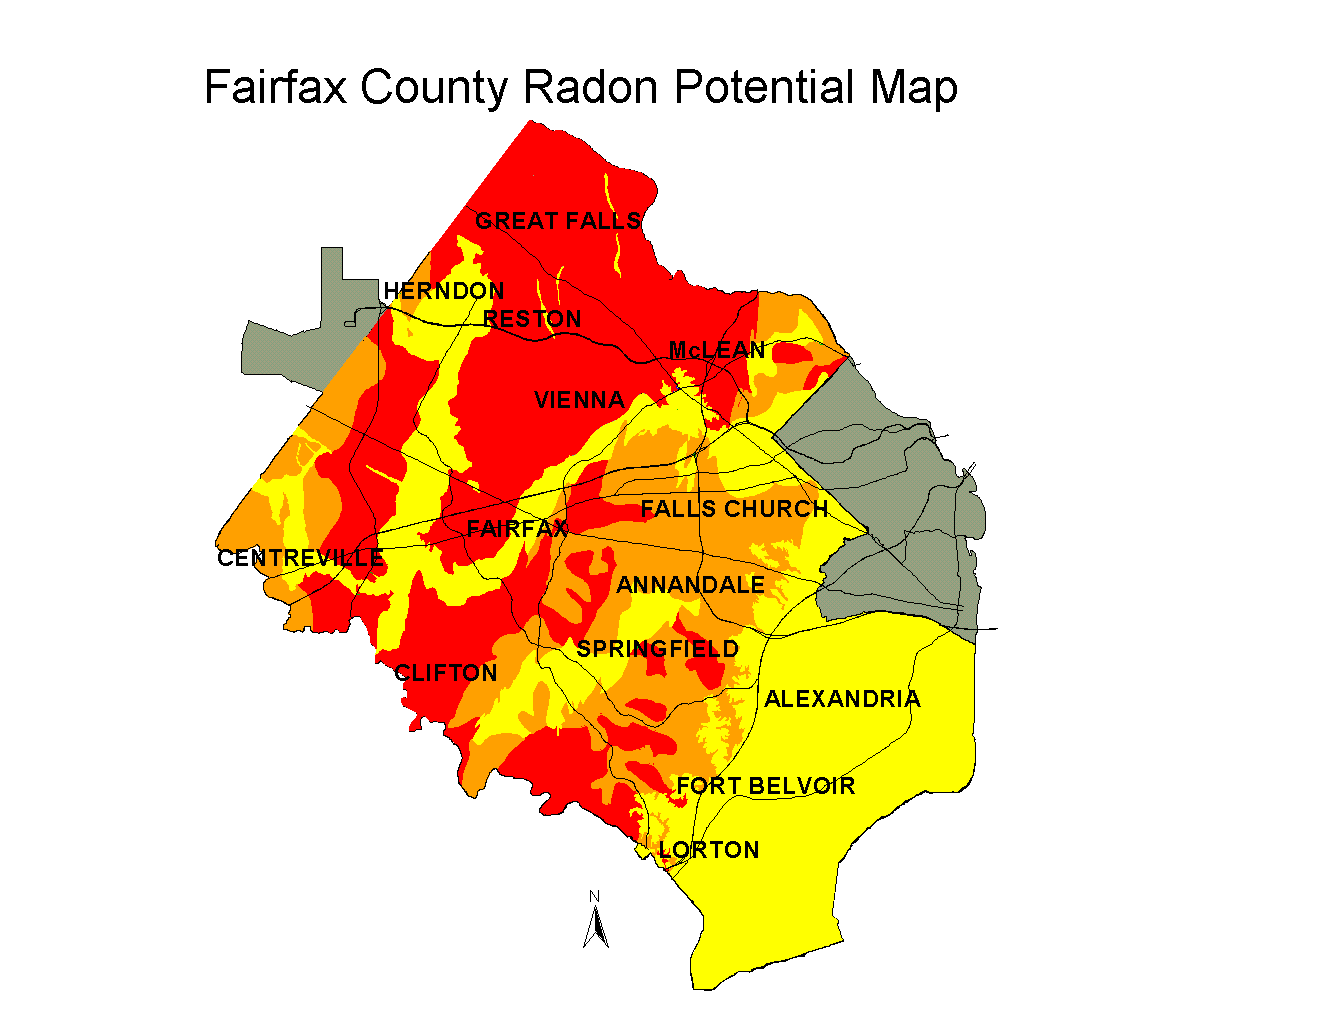
Radon Potential Map of Fairfax County
 EPA has identified the potential radon risk for the County of Fairfax as Zone 1 (High). This means the potential risk for average indoor radon screening levels would be greater than 4 pCi/l of air.
Fairfax County Health Department conducted a study of 2,142 homes during the winters of 1986-87 and 1987-88 to better characterize the relative risks in the County. They found that radon levels above the EPA action level of 4 picoCuries per liter of air can occur anywhere in the areas shown on the Fairfax County radon potential map. However, there are areas within Fairfax County where the risk of elevated radon was Low to Moderate. In the areas of low potential (yellow), 14 percent of the homes tested had radon levels that were a problem. At the other end of the radon range, only 44 percent of the homes tested in the areas of high potential (red) had elevated radon levels. This radon potential map can only provide a general guide of radon risk within Fairfax County, since homes with readings greater than and less than 4 pCi/l and be found on the same street.
Summary of the Fairfax County Health Department Radon Potential Study*
| Radon Potential |
Radon Measured |
| Environmental Protection Agency Zone |
Homes Tested |
Radon Concentrations |
Percentage of Homes by Radon Concentration |
Chance of 4.0 pCi/L or Greater |
| Average pCi/L |
Median pCi/L |
0 - 3.9 pCi/L |
4.0 - 9.9 pCi/L |
10.0 - 19.9 pCi/L |
20.0 pCi/L or Greater |
| High |
1 |
1086 |
5.5 |
3.5 |
56% |
32% |
8% |
4% |
44% |
| Moderate |
2 |
497 |
3.2 |
2.4 |
76% |
20% |
4% |
Less than 1% |
24% |
| Low |
3 |
599 |
2.2 |
1.5 |
86% |
13% |
1% |
Less than 1% |
14% |
*Data from the 2,142 homes tested during the winters of 1986-87 and 1987-88
The Radon Potential of Rocks and Soil in Fairfax County, Virginia, Button, James K, et al., 1988
Resources
 The U.S. Surgeon General released a National Health Advisory on January 13, 2005, which said;

 EPA has identified the potential radon risk for the County of Fairfax as Zone 1 (High). This means the potential risk for average indoor radon screening levels would be greater than 4 pCi/l of air.