Buildings are relevant to climate change in two major ways. First, energy use in buildings is responsible for more than 40% of Fairfax County’s greenhouse gas emissions that contribute to climate change based on the latest greenhouse gas emission inventory from the Metropolitan Washington Council of Governments. The county’s Community-wide Energy and Climate Action Plan (CECAP) and the Operational Energy Strategy (OES) provide goals and strategies for reducing energy use in community and county government buildings, respectively. Second, buildings themselves are vulnerable to climate change effects such as flooding, extreme heat, and storms. The county’s Resilient Fairfax plan provides goals for making infrastructure and buildings better able to withstand the effects of climate change.
This page highlights climate-related metrics for the Buildings sector.
EMISSIONS REDUCTION METRICS FOR BUILDINGS
Community Building Energy Consumption
Since 2005, total building energy consumption in the county has decreased despite an increase in population. While the decrease in 2020 and 2021 energy use may partially reflect the impact of the pandemic, overall declines since 2018 suggest that efficiency improvements in HVAC equipment, lighting, and appliances, as well as changing behavior, are more important factors. Moreover, total electricity use in the community has fallen nearly 3% since 2005, despite an over 15% increase in population and new use of thousands of electric vehicles during that time.
County Government Building Energy Consumption
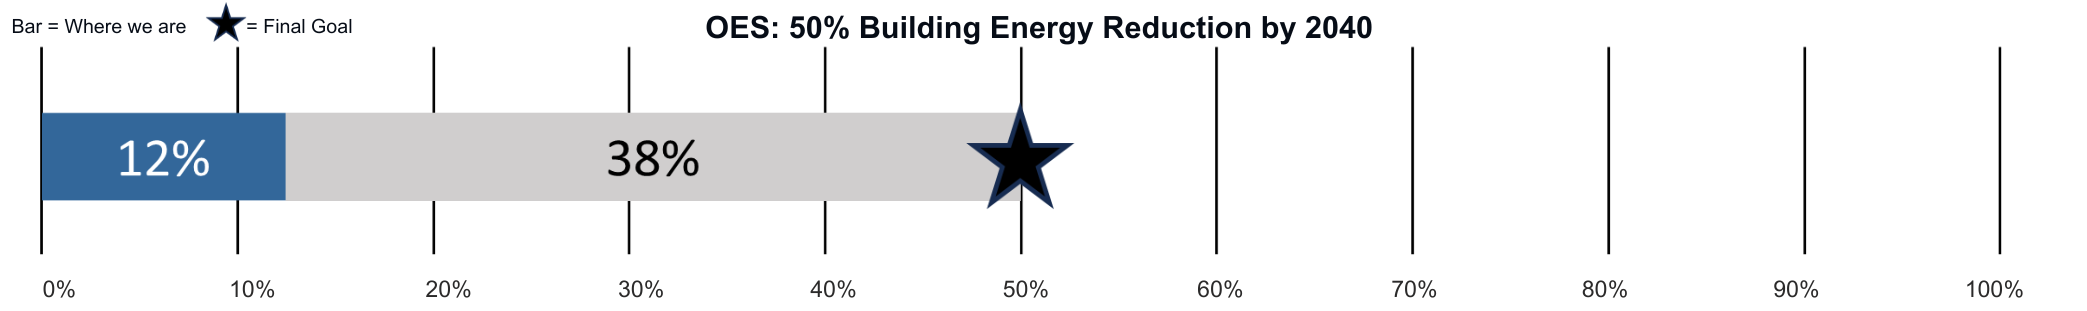
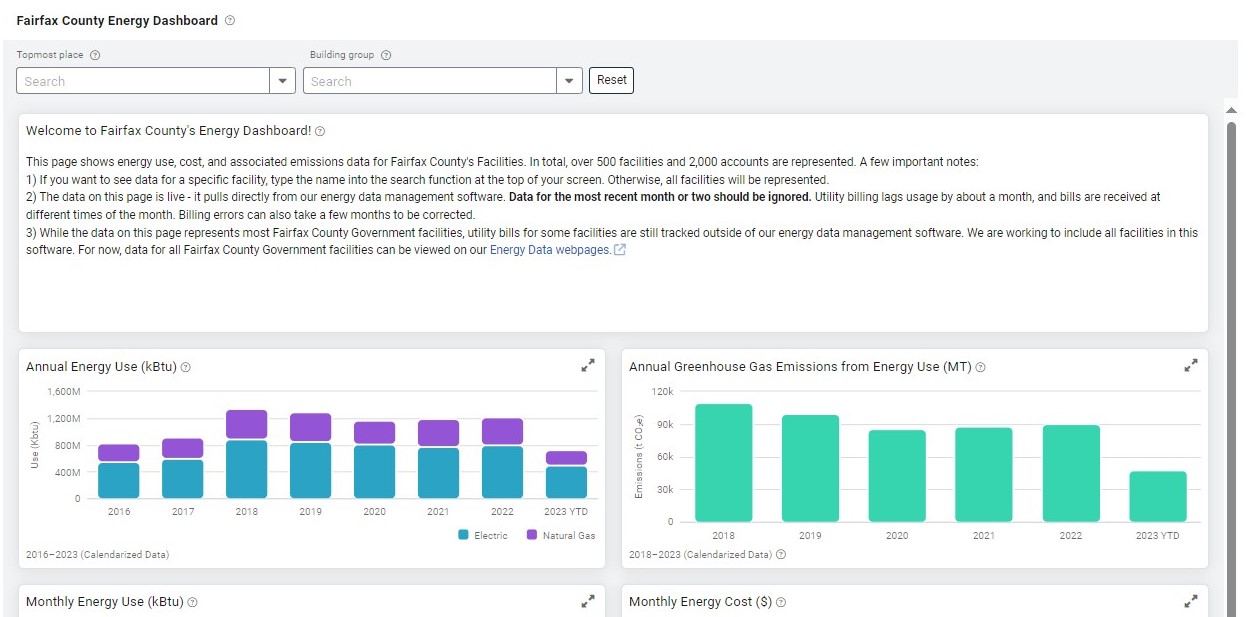
While CECAP adopted an overall goal of carbon neutrality by 2050, the OES sets a more ambitious goal – to achieve carbon-neutrality earlier, by 2040. Additionally, the OES targets a 50% reduction in energy used by county government buildings by 2040, and a 25% reduction by 2030. County government building energy use from recent years is available for review on the Fairfax County Government Energy Dashboard. Similar to the community-wide building stock, county government buildings are also using less energy since 2018. Note these datasets include energy used in non-building facilities like streetlights, pump stations, radio towers and maintenance sheds.
COUNTY GOVERNMENT (OES) GOAL: 50% county government building energy reduction by 2040
Click image below to view the Fairfax County Government Energy Dashboard page.
Increasing Energy Efficiency and Conservation in Existing Buildings
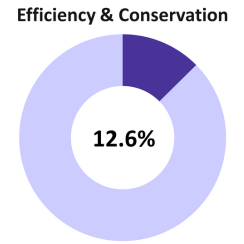
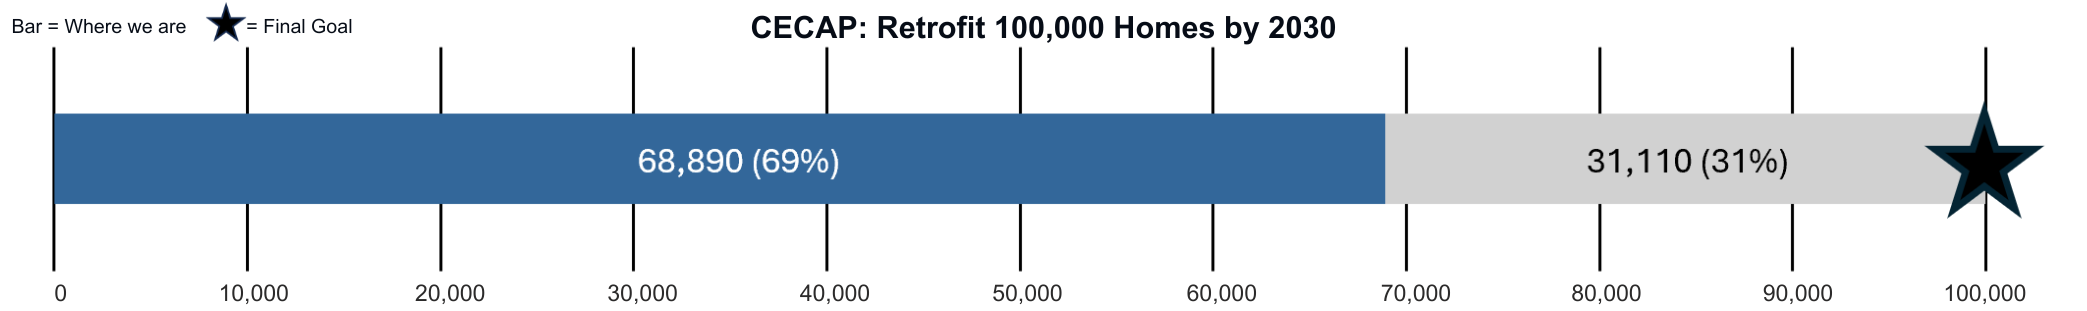
CECAP sets a goal of retrofitting at least 100,000 housing units with energy efficiency measures by 2030. This aligns with the strategy to increase energy efficiency and conservation in existing buildings and accounts for 12.6% of the emissions reduction needed to meet the 2050 CECAP goal.
COMMUNITY (CECAP) GOAL: Retrofit at least 100,000 homes with energy efficiency improvements by 2030
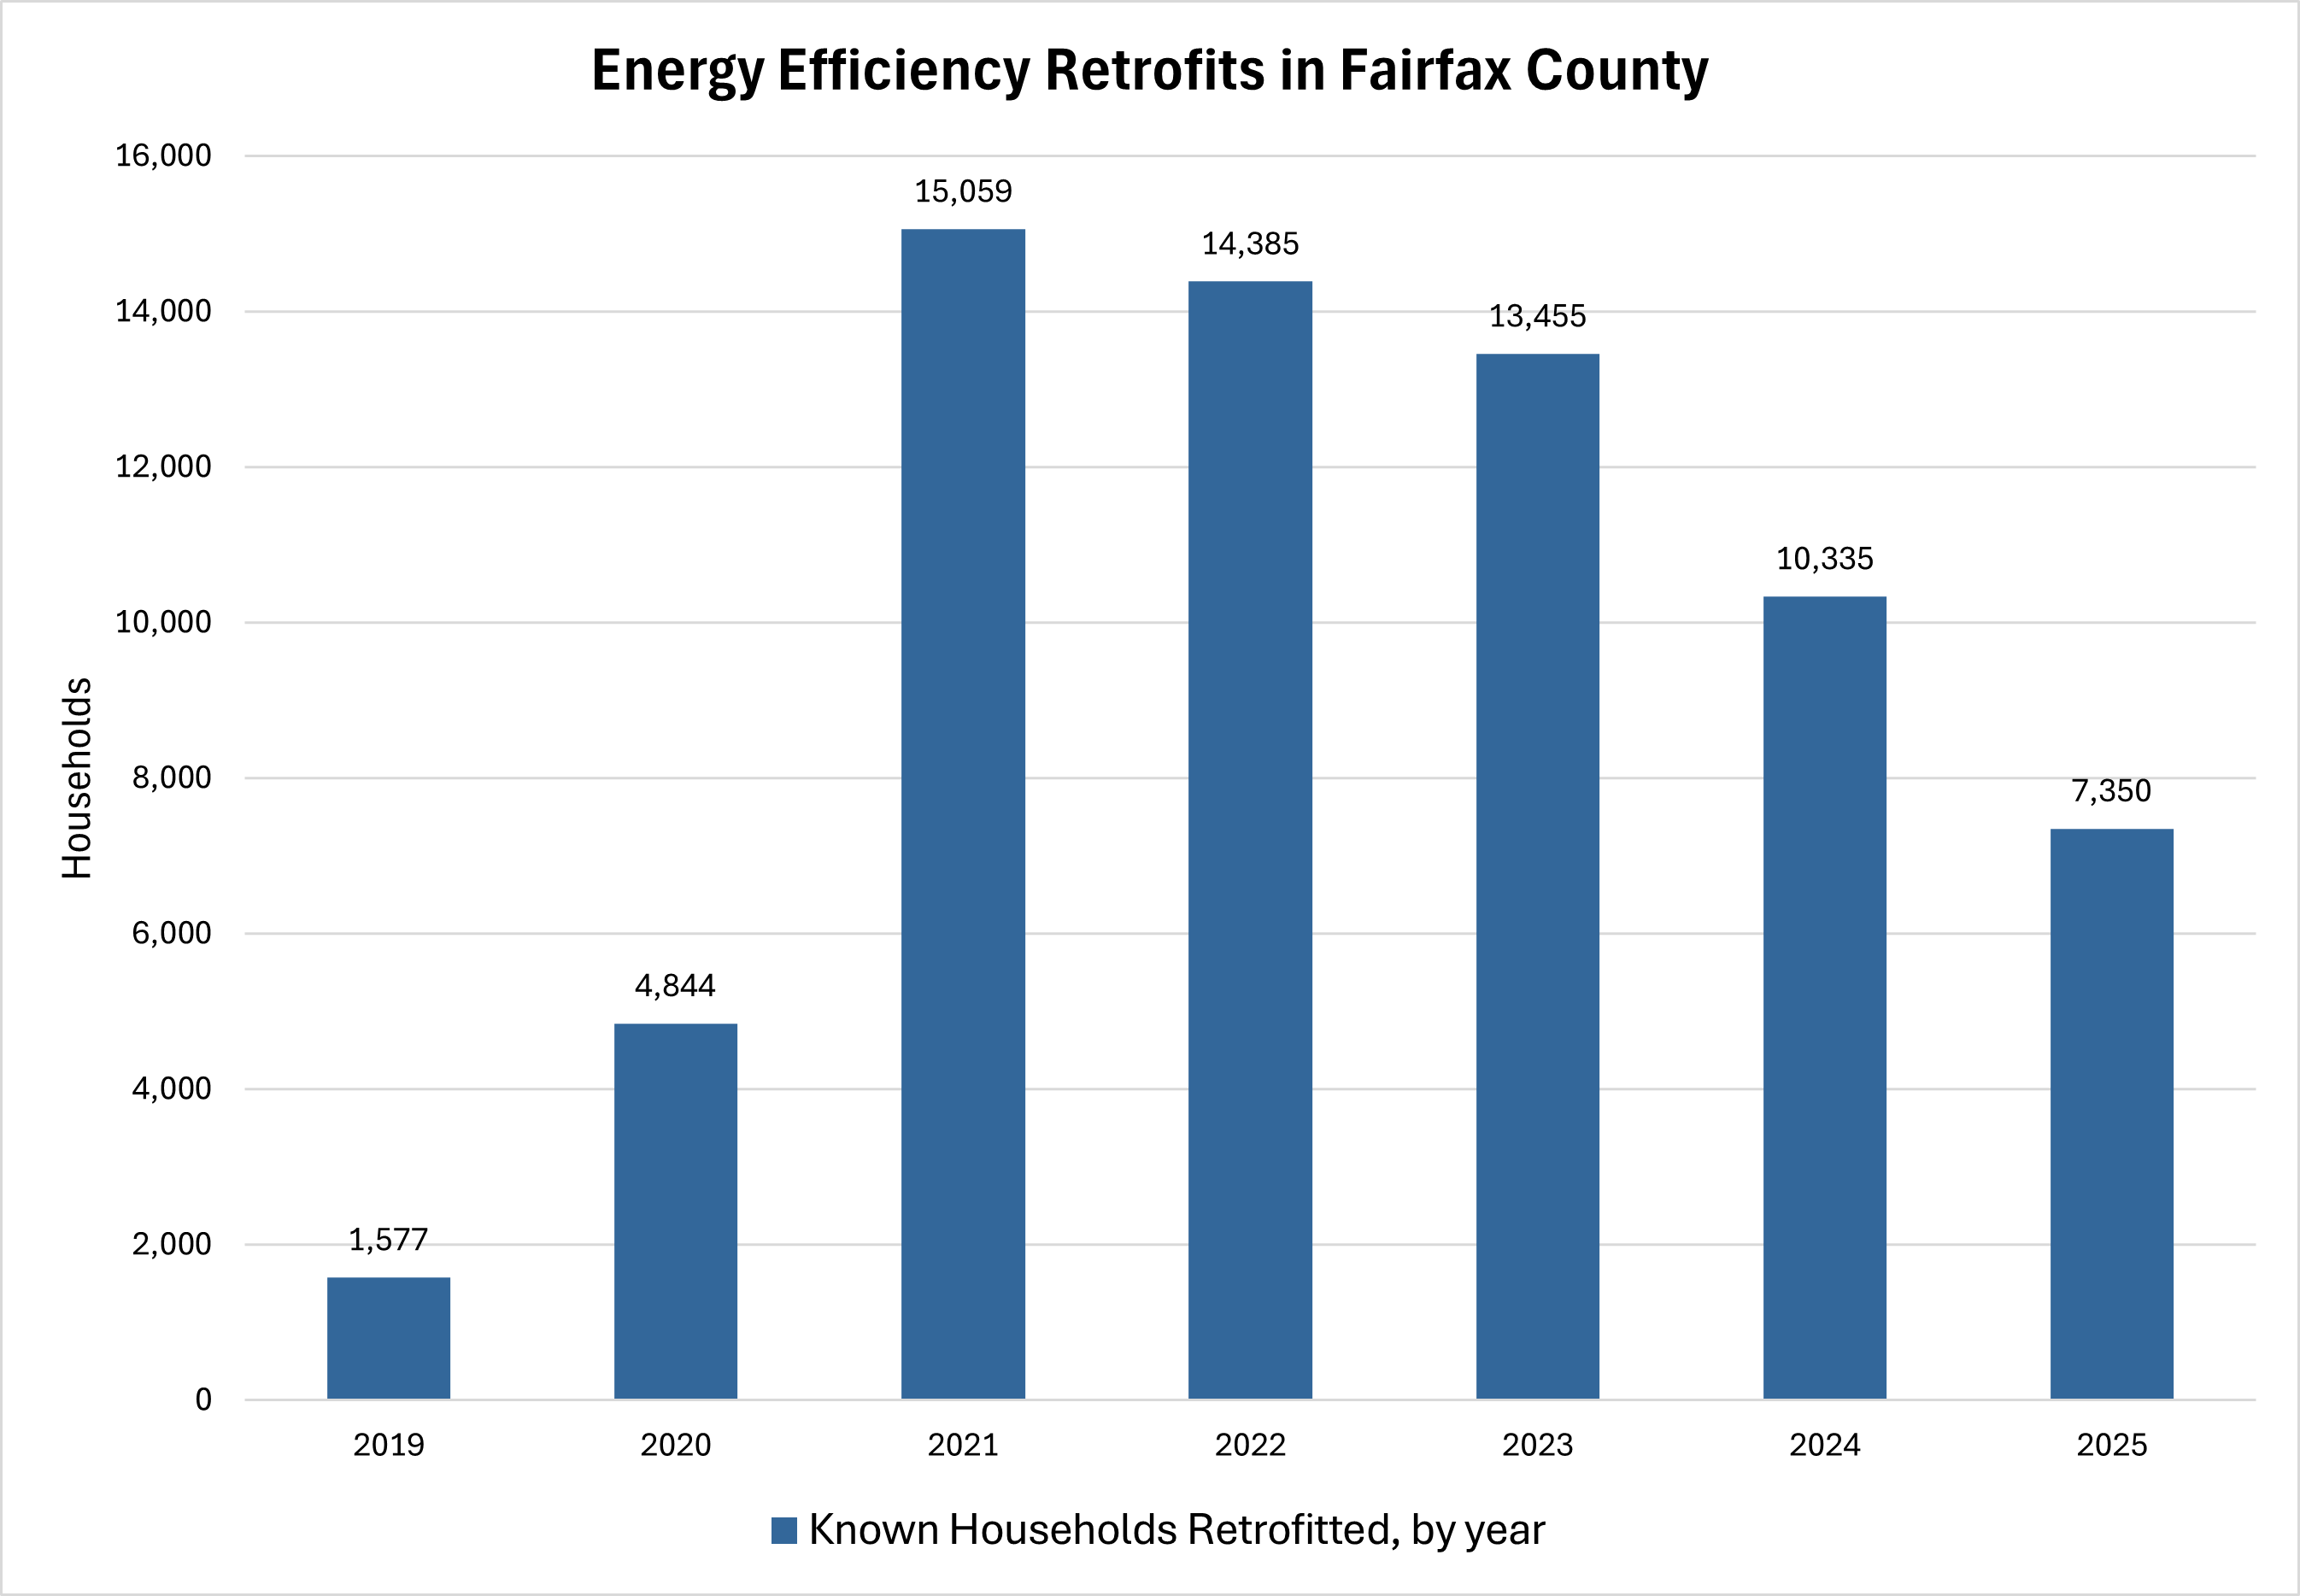
COMMUNITY (CECAP) PROGRESS TO DATE: The graphics below show residential energy retrofits by year and cumulative progress toward CECAP’s 2030 goal. These retrofits were completed by Community Housing Partners or independently by homeowners who participated in Dominion Energy’s residential energy efficiency programs. The numbers also account for residents who took advantage of county programs including rental of thermal cameras and conserve kits from the libraries, which serves as a proxy for residents who did work that is not captured in other programs. Beyond these numbers, this dataset may not include the full number of retrofits completed in Fairfax County because homeowners can perform retrofits without participating in any specific government, non-profit, or utility rebate program, and therefore, may not report the retrofit.
COUNTY GOVERNMENT (OES) PROGRESS TO DATE: The graphic below shows the number of county government building retrofits completed each year since 2019 and the total energy savings from these projects. 2019 had an unusually high number of lighting retrofits. Development of the Energy Savings Performance Contracting (ESPC) slowed progress in the following years. Although the number of retrofits each year is lower, overall energy savings kept increasing thanks to these energy efficiency projects. Refer to our Completed and Planned Solar at Fairfax County Government Facilities map on the Energy Supply Metrics page for more information on planned and completed projects.
Electrifying Existing Buildings
By 2050, 304,000 (or 70%) single-family homes, 71,000 (or 50%) multifamily homes, and 54 million ft2 (or 20%) of commercial building space could be fully electrified, based on CECAP modeling projections. Building electrification accounts for 10.9% of the emissions reduction needed to meet the 2050 CECAP goal.
COMMUNITY (CECAP) PROGRESS TO DATE: Data is not available at this time.
COUNTY GOVERNMENT (OES) PROGRESS TO DATE: The graphic below shows the relative proportions of county government buildings in the portfolio that are fully electric, primarily heated by electricity source equipment (“Electric Primary” – less than 10% of building energy use coming from natural gas), and natural gas heated. As part of the effort to decrease energy use in buildings, OES promotes a strategy to replace fossil-fuel heating and water heating equipment with efficient electric alternatives. Additionally, all new buildings, additions and major renovation projects greater than 10,000 ft2 have been designed electric ready since 2021, and projects that began design after July 1, 2024, will be built with only electric equipment and appliances.
Green Building Practices
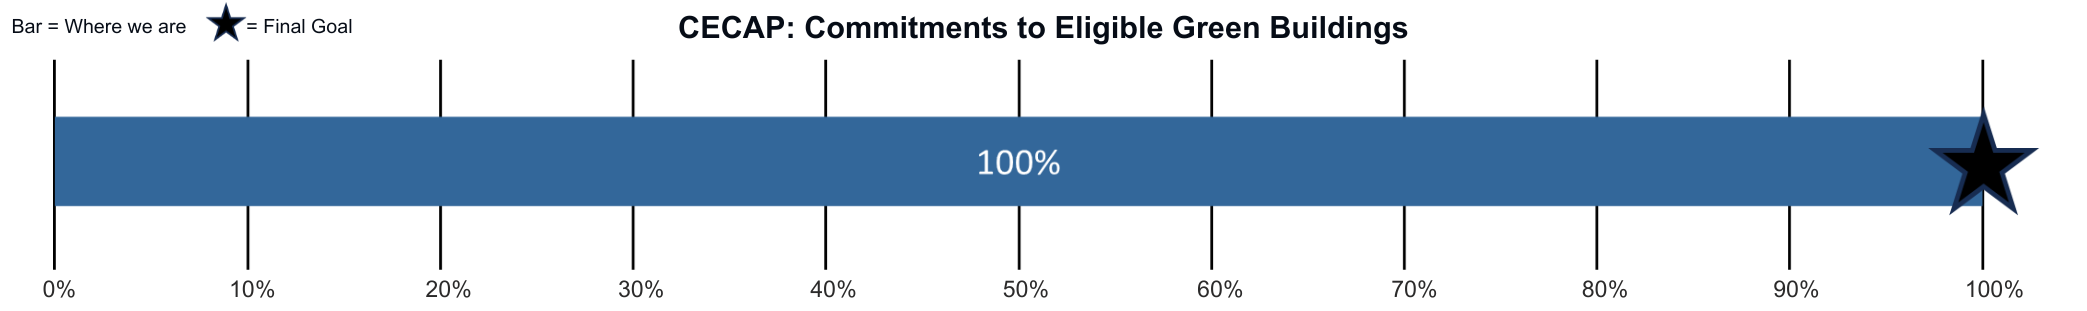
CECAP sets a goal for all new buildings to have a commitment to green building. This aligns with the strategies to increase building code stringency, support all-electric building construction, and support reuse of existing buildings. This goal accounts for 1.2% of the emissions reduction needed to meet the 2050 CECAP goal.
COMMUNITY (CECAP) GOAL: All new eligible* buildings will have a commitment to green building
*Eligible buildings refer to private buildings that go through an entitlement process. For example, if someone builds a house in a residential district, or a business in a commercial district, those are not subject to any proffers and are not counted in this energy efficiency metric.
COMMUNITY (CECAP) PROGRESS TO DATE:This goal was reached as part of the green building policy in the Comprehensive Plan. The green building policy is part of the Environment element of the Comprehensive Plan Policy Plan. The Environment element was amended in December 2025 to strengthen policies related to energy efficiency, green buildings, and climate and resilience goals.
This interactive map, provided by Northern Virginia Regional Commission,shows the geographic distribution of LEED-certified commercial buildings across the Northern Virginia region. These trends are indicative of the local building design and construction industry incorporating green building standards through rating systems like LEED and through increasingly strict building energy codes. Fairfax County has seen similar trends in certifications over the past decade compared to the wider Northern Virginia region.
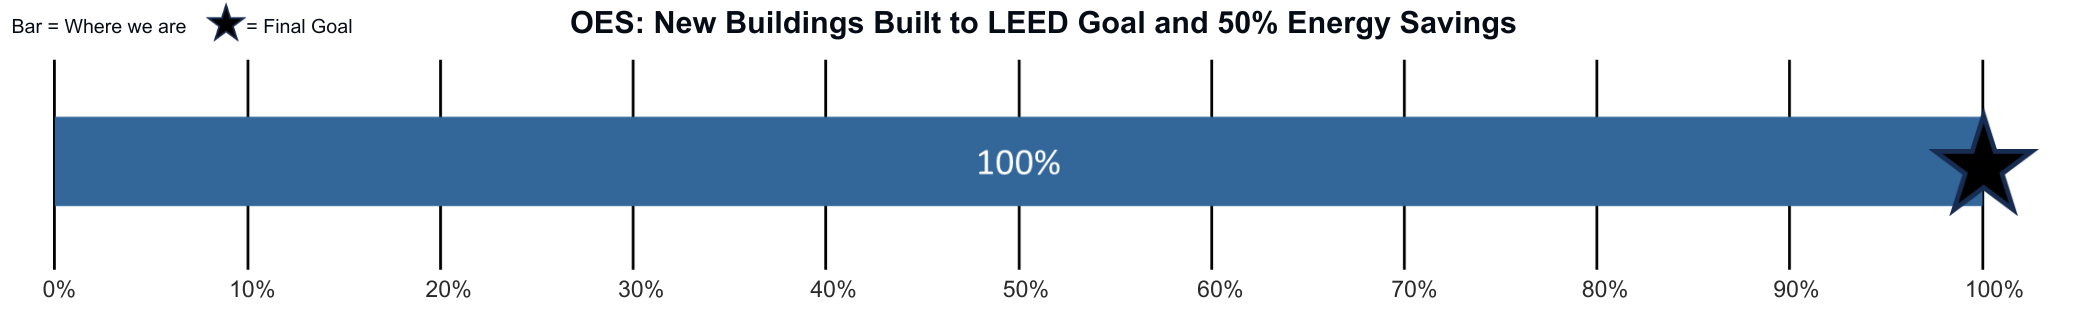
COUNTY GOVERNMENT (OES) GOAL: New county government buildings built to LEED Goal and 50% energy savings
COUNTY GOVERNMENT (OES) PROGRESS TO DATE: This goal has been reached, due to the county policy. The policy will continue to be updated to continually increase standards.
The map graphic below shows the geographic distribution of county-owned buildings which have achieved LEED certifications. The OES sets a target for all new buildings and major renovations greater than 10,000 ft2 to be designed to achieve at least LEED Gold including a 50% energy performance improvement over the LEED baseline. With the adoption of the OES, many more LEED certified buildings will be completed in the coming years. Visit the Green Buildings webpage to learn more.
>
RESILIENCE METRICS FOR BUILDINGS
Buildings can be vulnerable to certain climate-related shocks and stressors, such as increases in extreme heat, flooding, and severe storms. Addressing these vulnerabilities is critical, because buildings are where we live, work, learn, recreate, shop, and obtain services.
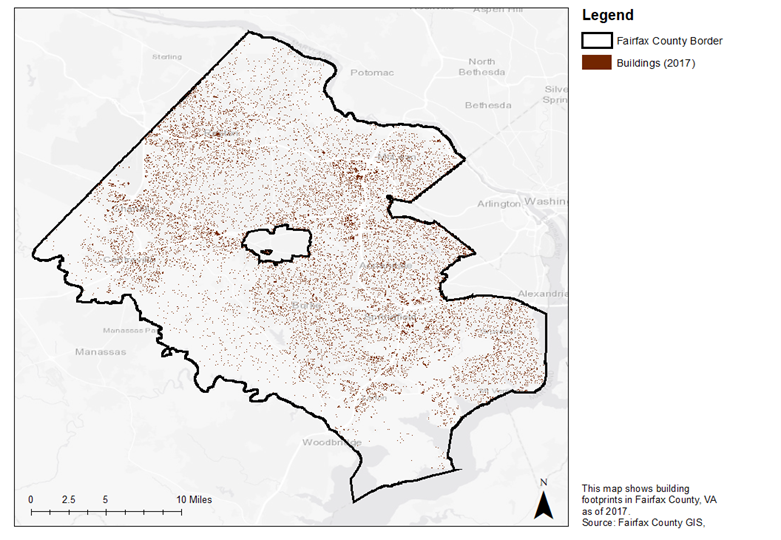
There are approximately 260,000 buildings within county borders, and 93% of those are residential buildings. The map below shows the locations of buildings in Fairfax County.
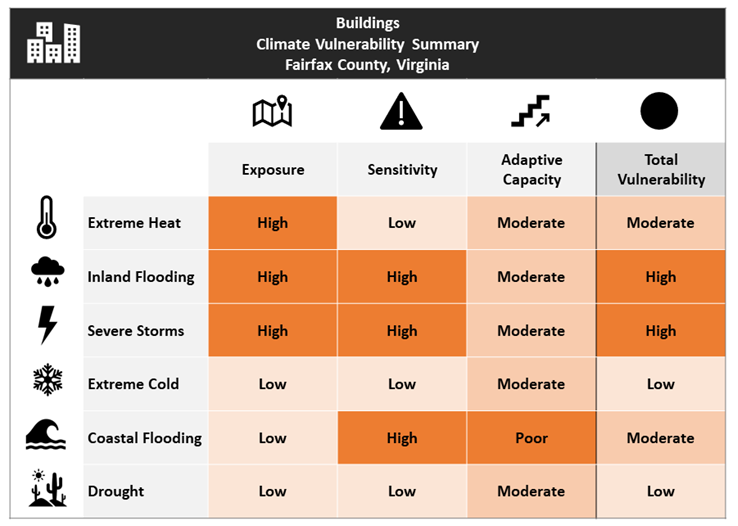
The table below provides an overview of the climate vulnerabilities for buildings in Fairfax County. These vulnerability scores were based on a combination of exposure (how exposed is the infrastructure exposed to the hazard, and is that hazard increasing or decreasing?), sensitivity (when the infrastructure is exposed, does something bad happen?), and adaptive capacity (can the infrastructure adapt to changing conditions?). The table shows that buildings have a high vulnerability to inland flooding and severe storms, and a moderate vulnerability to extreme heat and coastal flooding.
Buildings and Extreme Heat
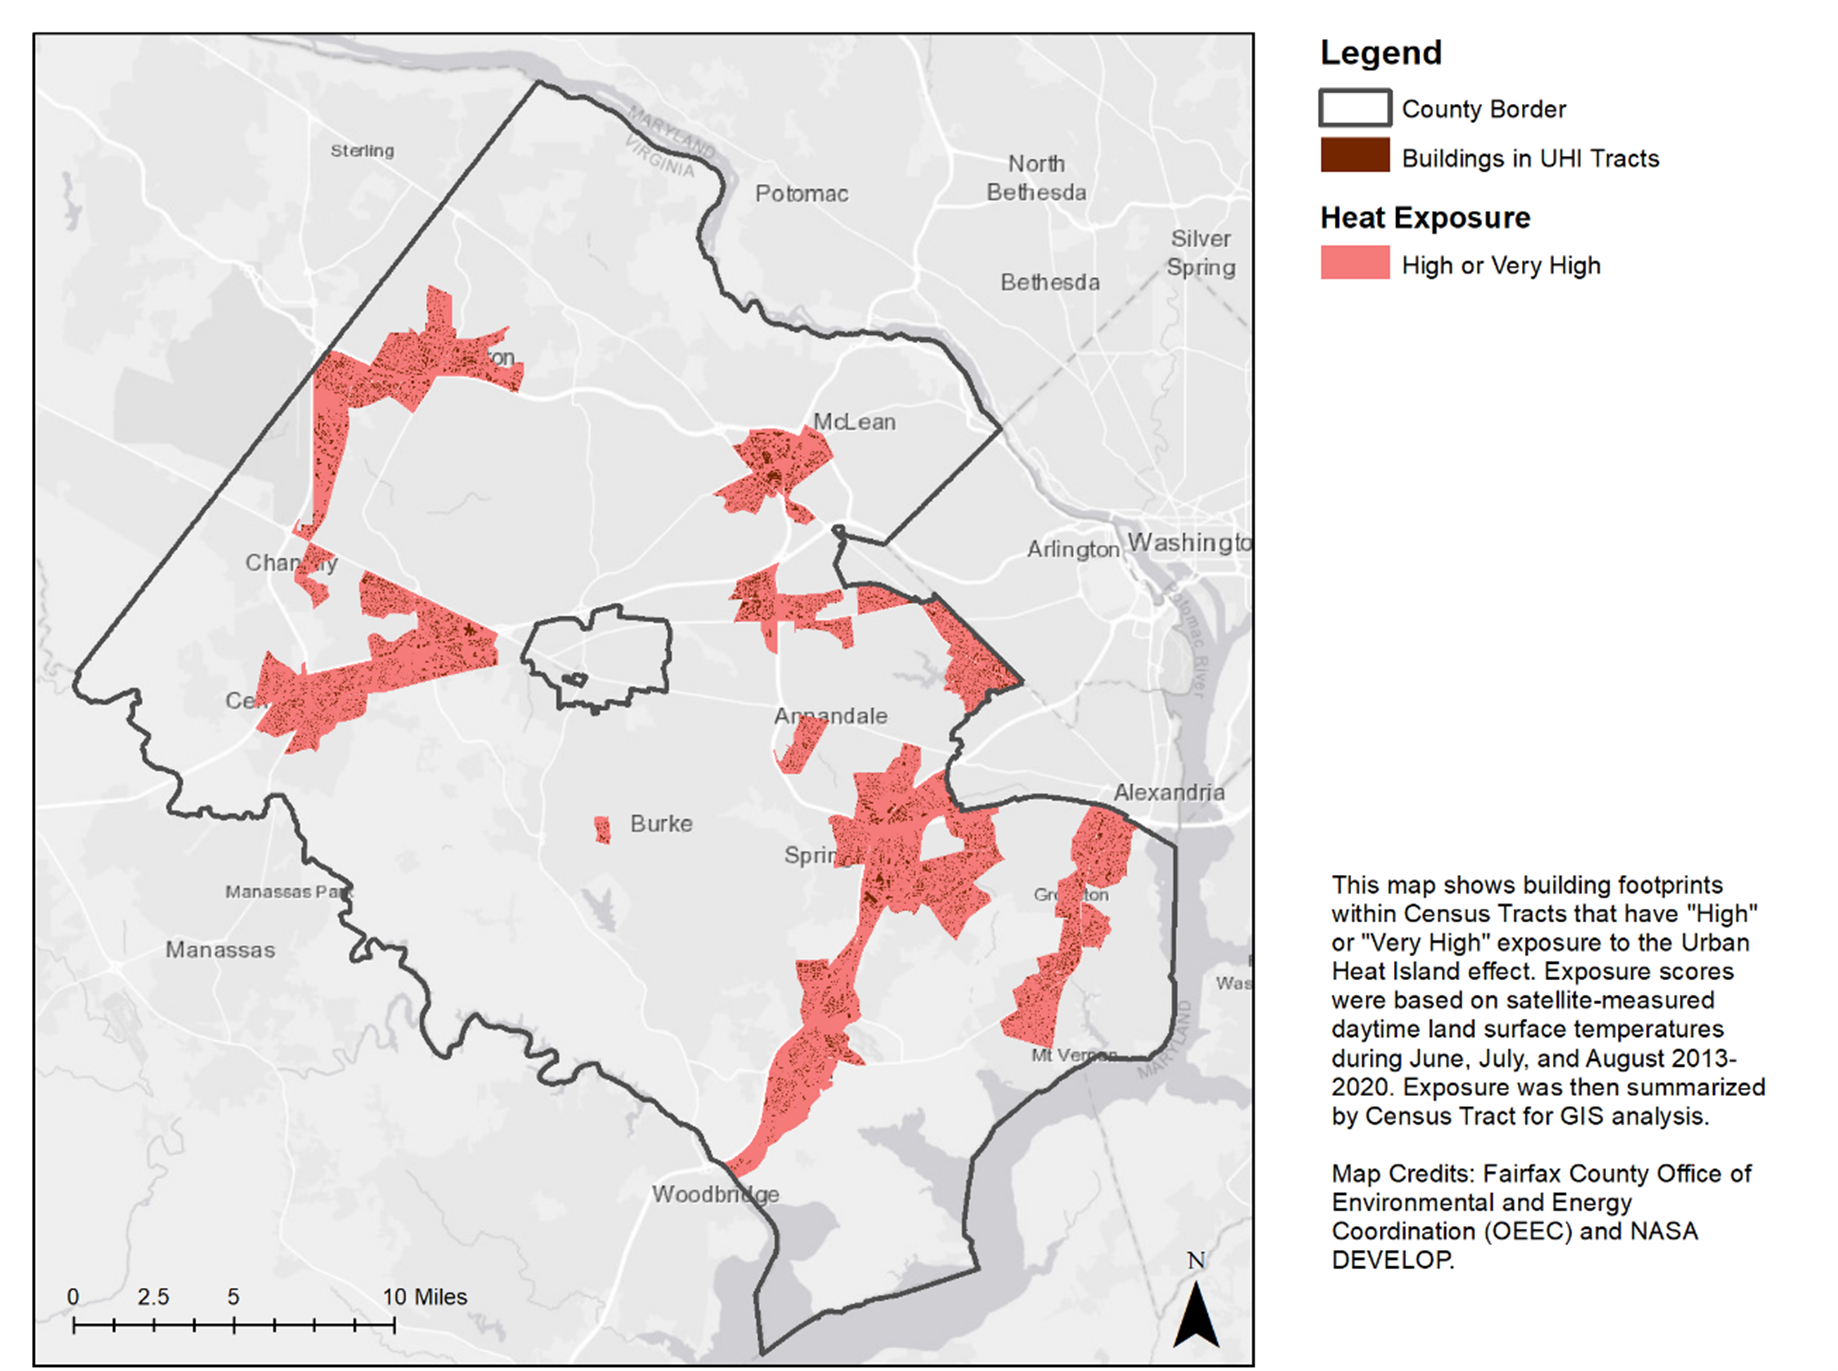
Temperatures and extreme heat have been increasing in Fairfax County. All buildings may be exposed to extreme heat when it occurs, but buildings in Urban Heat Islands (UHIs) are exposed to higher temperatures than others. The map below shows buildings in Fairfax County that are in Urban Heat Islands (summarized by Census Tract).
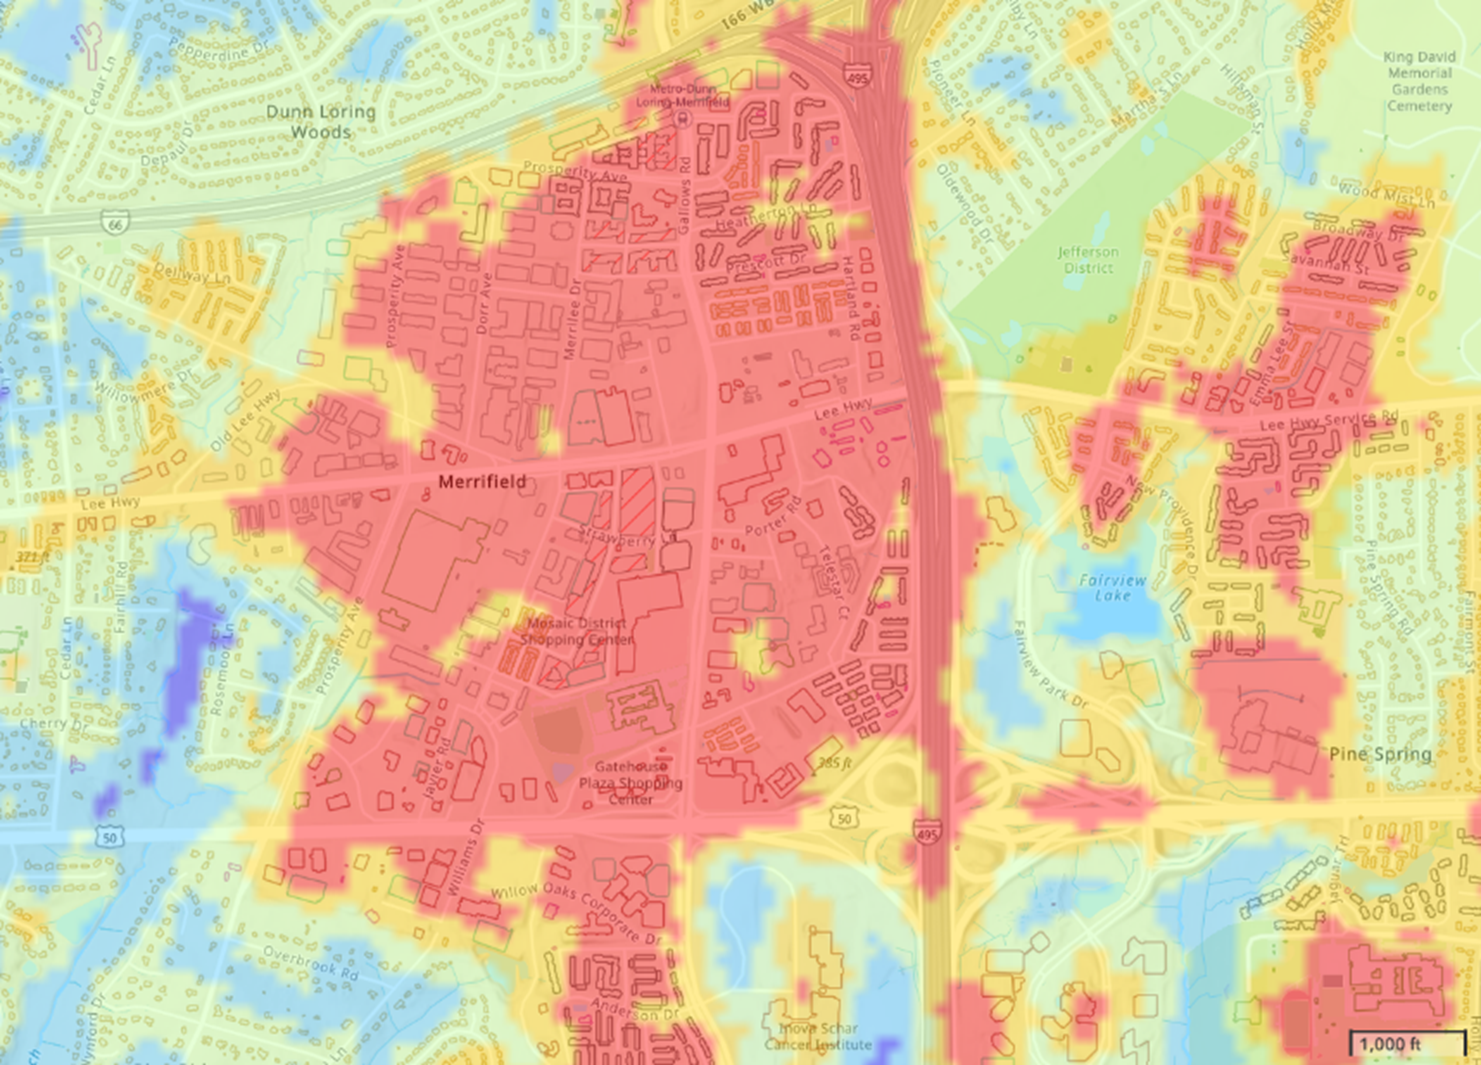
The map image below shows a zoomed in view of one of the Urban Heat Islands in Fairfax County, in the Merrifield Area. The outlines of buildings can be seen on the map. Buildings within the red area are in Urban Heat Islands, where land surface temperatures are consistently higher than other areas. For an interactive version of this map, please see the Resilient Fairfax Interactive Map Viewer.
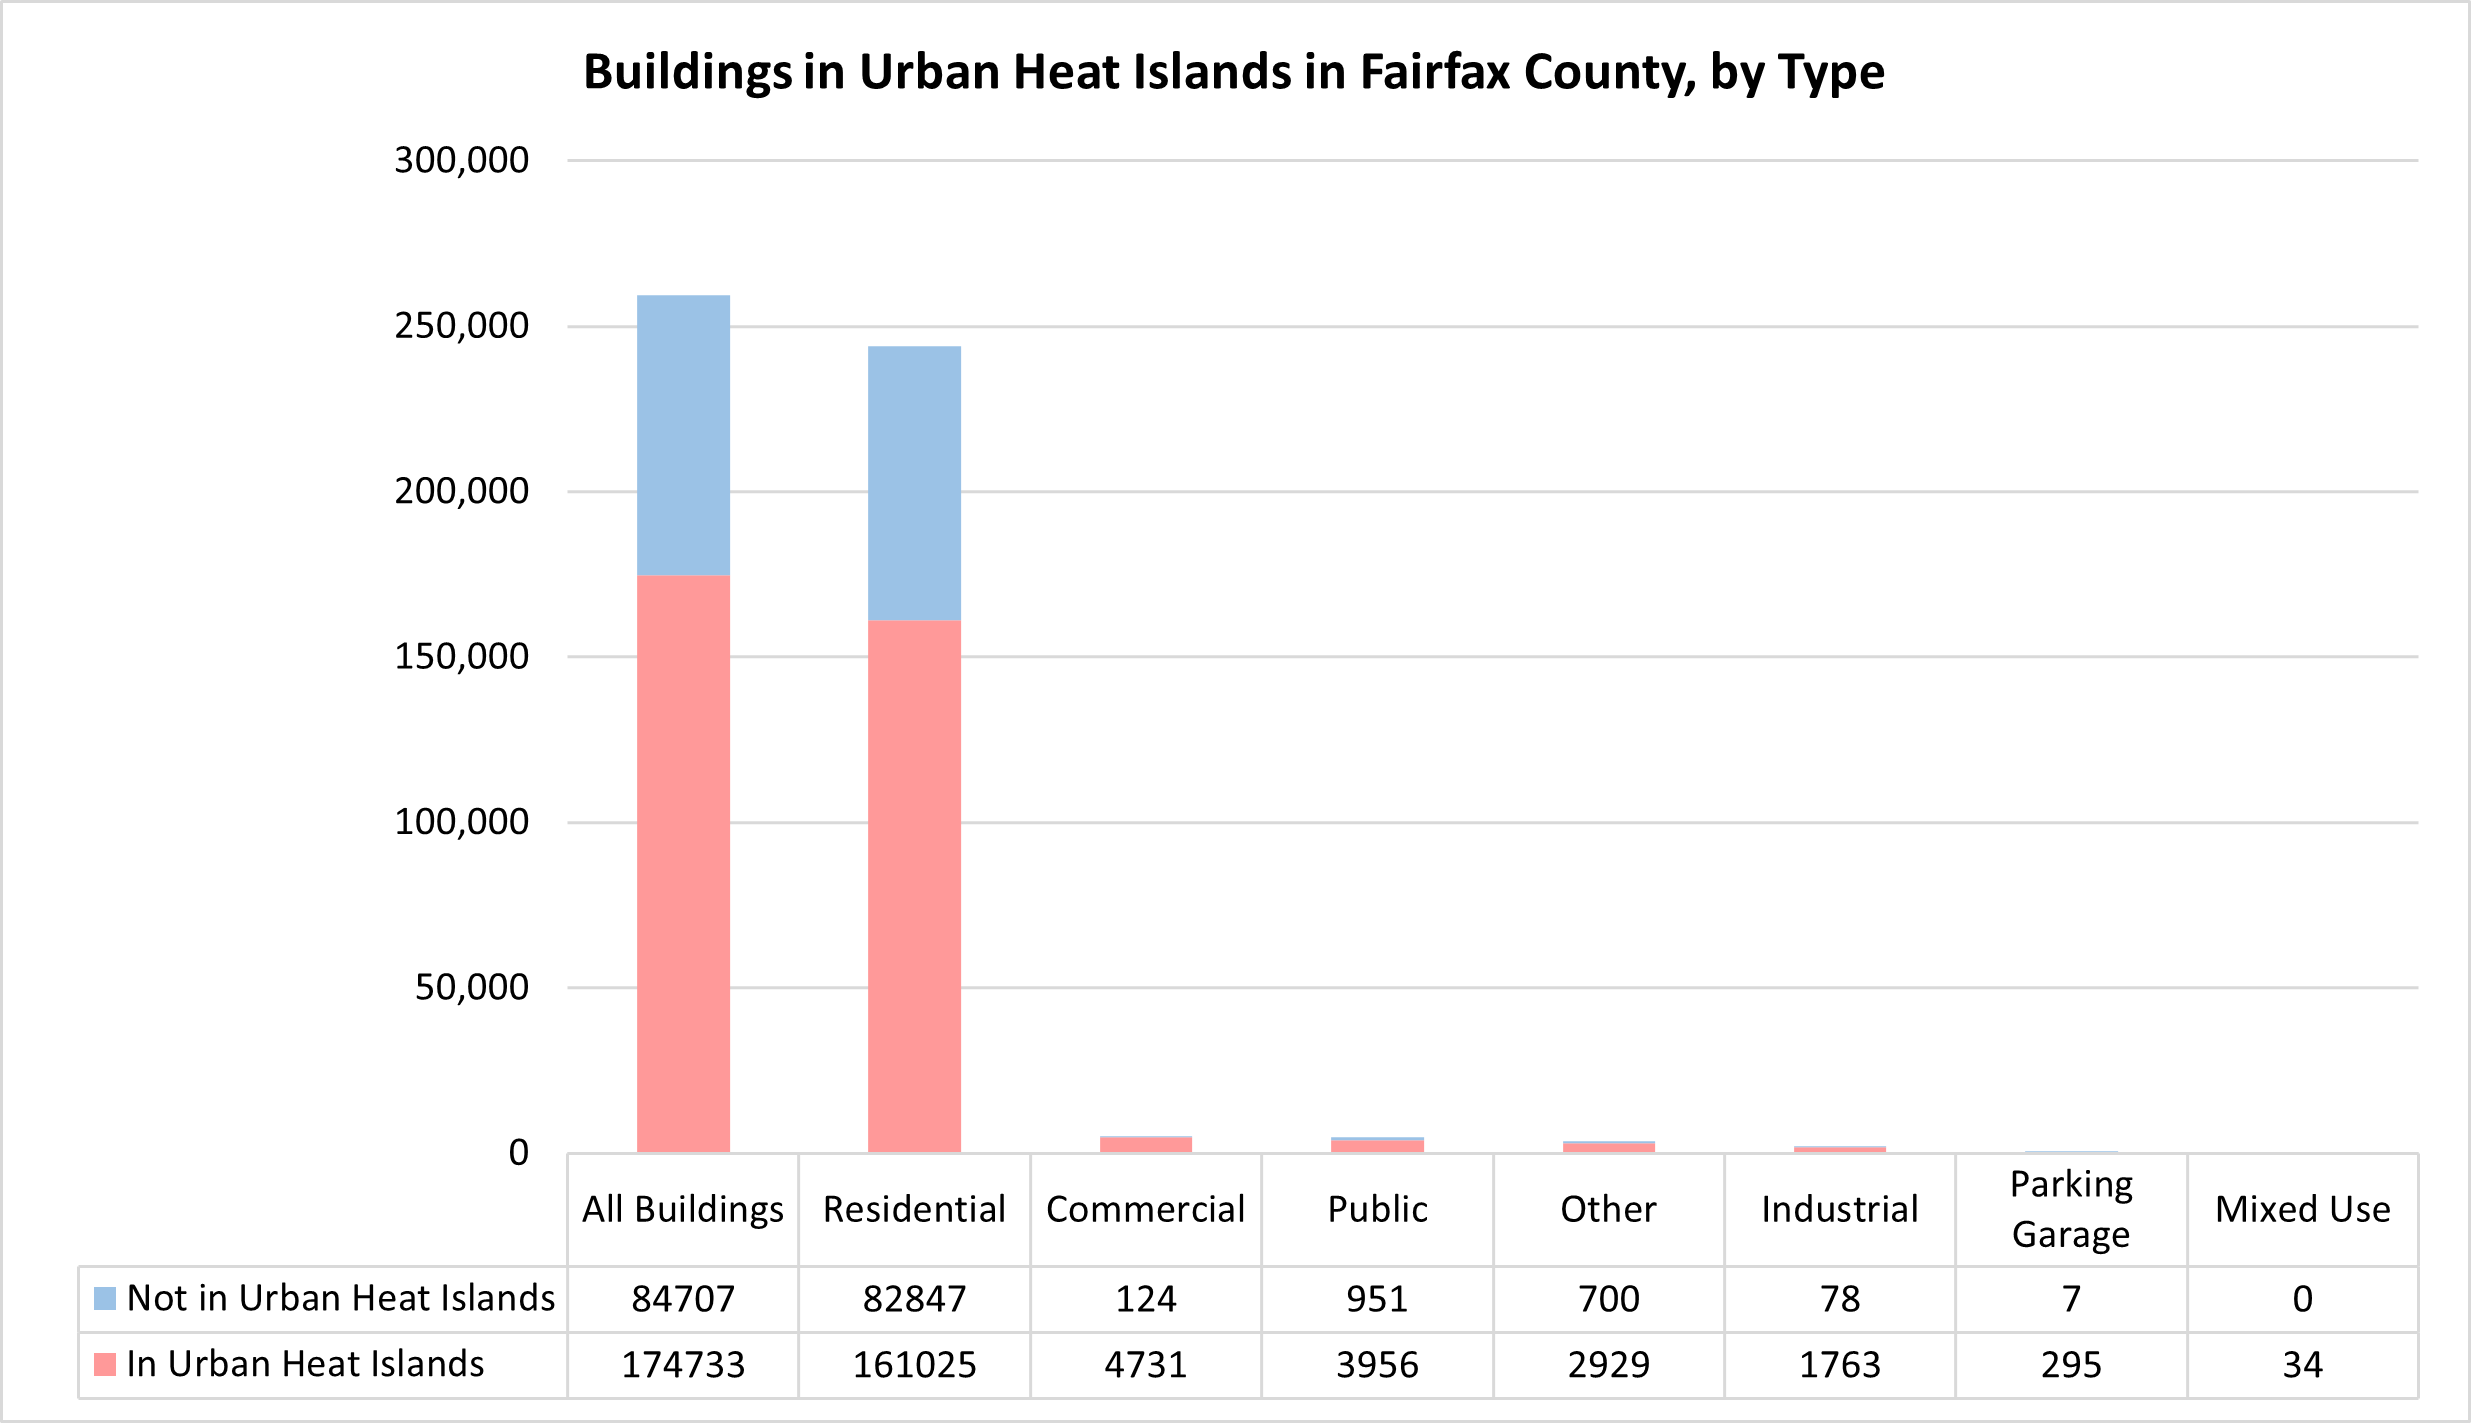
Approximately 67% of buildings in Fairfax County are in significant Urban Heat Islands. This is logical, because the Urban Heat Island effect itself is created when dark-colored surfaces such as asphalt and densely built buildings absorb heat, and there is a lack of green space to cool things down. Because 93% of all buildings in Fairfax County are residential buildings, most of the buildings in Urban Heat Islands are also residential buildings.
In terms of vulnerability, the people inside buildings have a much higher sensitivity to extreme heat than the buildings themselves. Structurally, buildings can usually withstand heat up to 110F without much impact or degradation. However, buildings subject to extreme heat can become dangerous if they are poorly ventilated. Additionally, higher demand for cooling can result in heightened energy costs, and older HVAC equipment may be unable to handle extreme heat events.
Buildings and Flooding
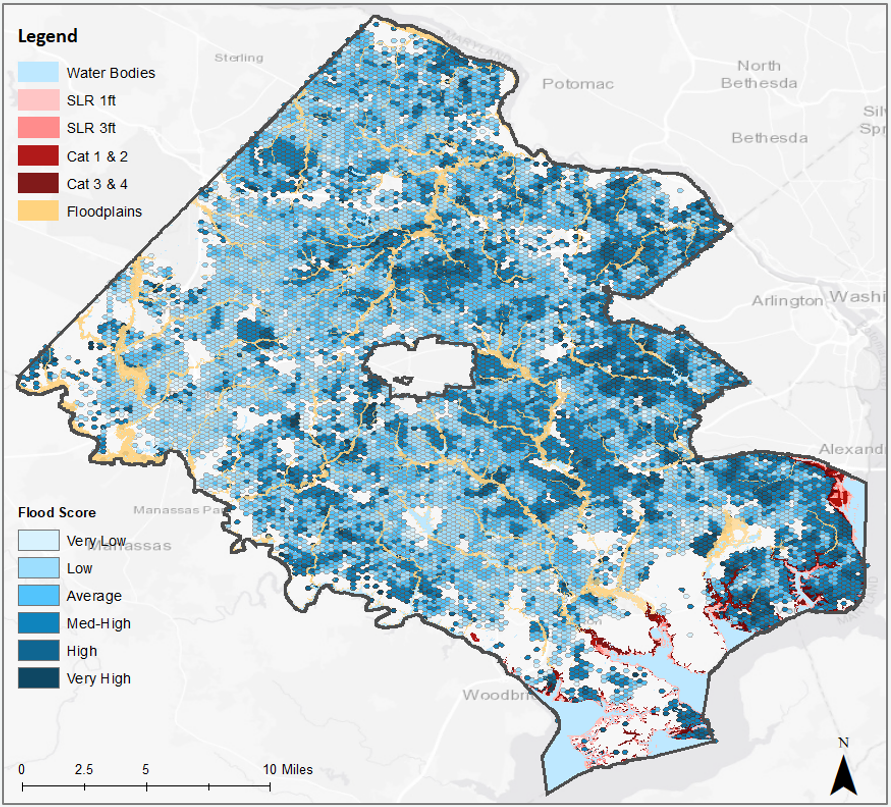
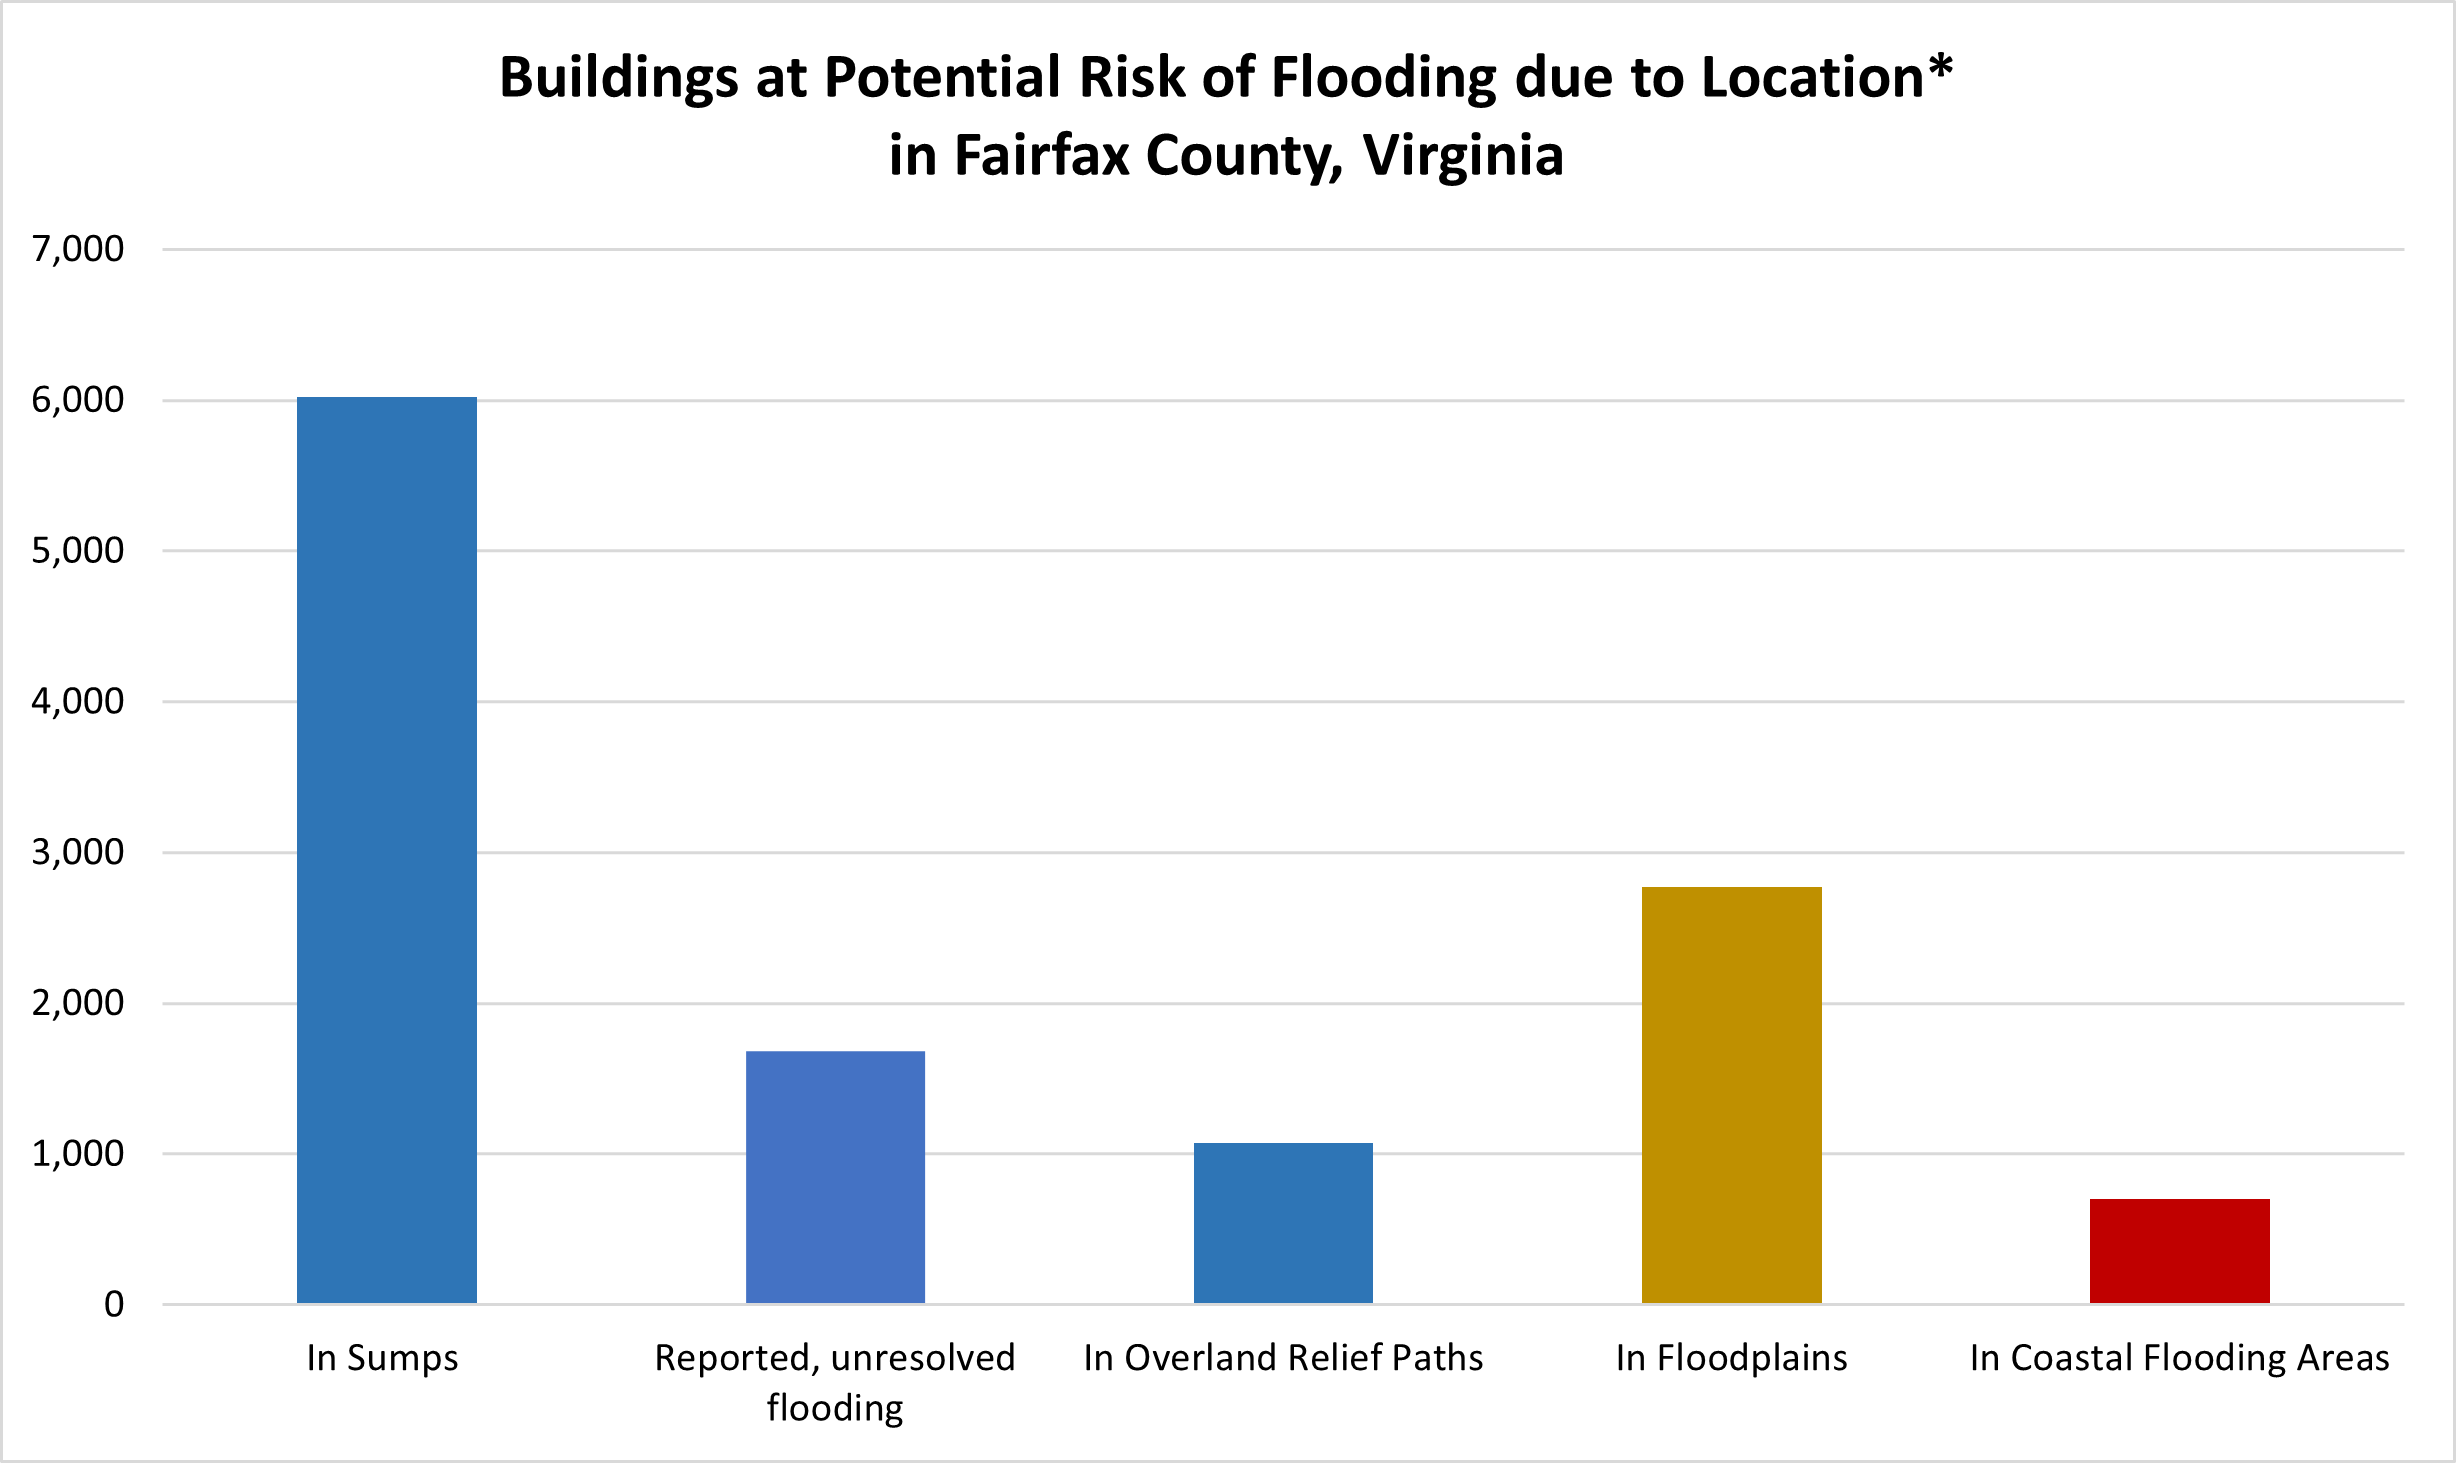
Buildings can be exposed to a few different flooding types in Fairfax County. Floodplain or riverine flooding occurs when water bodies overflow onto their banks. Approximately 2,215 buildings (or 0.9% of buildings) in Fairfax County are in FEMA Special Flood Hazard Area (“100 year”) floodplains. Floodplains in the map and graph below are shown in yellow.
Coastal flooding in Fairfax County refers to flooding of the Potomac River and associated tidal water bodies as a result of sea level rise, high tide, storm surge, or a combination thereof. Approximately 699 buildings (or 0.9% of buildings) are vulnerable to coastal flooding in Fairfax County. Coastal flooding in the map and graph below is shown in red. Urban or pluvial flooding occurs when heavy rain overwhelms stormwater management systems, pools in low-lying areas (sumps), cannot sink into the ground, or is blocked from reaching waterways (overland relief paths blocked). The exact number of structures vulnerable to urban flooding in Fairfax County varies but is consistently higher than those vulnerable to floodplain flooding. As of 2021, over 97% of flooding-related service requests were not in floodplains. (See Resilient Fairfax Vulnerability and Risk Assessment).
The graph below shows the number of buildings potentially at risk of flooding due to their location in sumps, overland relief paths, floodplains, or coastal flooding areas. The data is from a combination of DPWES’ ANALYZING FLOOD RISK IN FAIRFAX COUNTY and Resilient Fairfax data.
*Notes: These flooding types are not mutually exclusive. For example, some coastal flooding areas are also floodplains. Additionally, these data are not a full count of buildings that may be vulnerable to flooding. There are additional types of flooding such as flooding caused by cloud bursts that cannot be consistently mapped by location.
When exposed, buildings are highly sensitive to flooding. Flooding can cause significant physical damage to buildings and their contents. In severe cases, structures and their contents may be unsalvageable, especially when flooding includes sanitary sewer overflows. Excessive moisture produces an increased risk of mold which thrives in wet and warm conditions. The good news is that buildings have a moderate capacity to adapt to flooding through floodproofing, elevation, improved stormwater management, and other strategies. Fairfax County has numerous policies, programs, and regulations in place to reduce the impacts of flood damage. For more information, please visit Stormwater Management.
Ready to take action? Visit our Buildings and Energy page to find information and resources for exploring how cleaner and greener energy can be used to power our homes and businesses. This includes lowering your costs and your carbon footprint by being more energy efficient, adopting green building standards, and investing in renewable sources of energy such as solar.
Fairfax County is encouraging residents to take climate action into their own hands using BrightAction! This new climate engagement platform makes it simple, easy, and fun to learn about climate solutions and take action through an interactive dashboard. Sign up now to start reducing your environmental impact through progress tracking, daily reminders, and collaboration with friends, family, and colleagues!


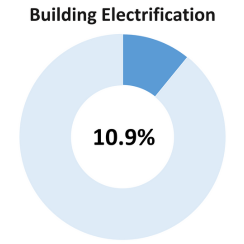 By 2050, 304,000 (or 70%) single-family homes, 71,000 (or 50%) multifamily homes, and 54 million ft2 (or 20%) of commercial building space could be fully electrified, based on CECAP modeling projections. Building electrification accounts for 10.9% of the emissions reduction needed to meet the 2050 CECAP goal.
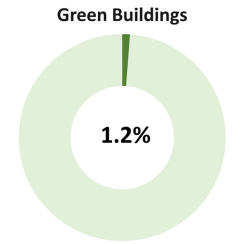 CECAP sets a goal for all new buildings to have a commitment to green building. This aligns with the strategies to increase building code stringency, support all-electric building construction, and support reuse of existing buildings. This goal accounts for 1.2% of the emissions reduction needed to meet the 2050 CECAP goal.