RESILIENCE METRICS FOR TRANSPORTATION
A safe, efficient, and accessible transportation system is critical to a thriving community. When climate hazards affect our transportation infrastructure, there can be cascading impacts to many other sectors and services. Climate hazards affecting transportation infrastructure can include both long-term stressors (such as increased extreme heat) that accelerate degradation of the infrastructure over time, and short-term shocks (such as more frequent severe storms) that have immediate impacts. By assessing the vulnerabilities of our transportation infrastructure to changing climatic conditions, we can make ourselves more resilient to these impacts.
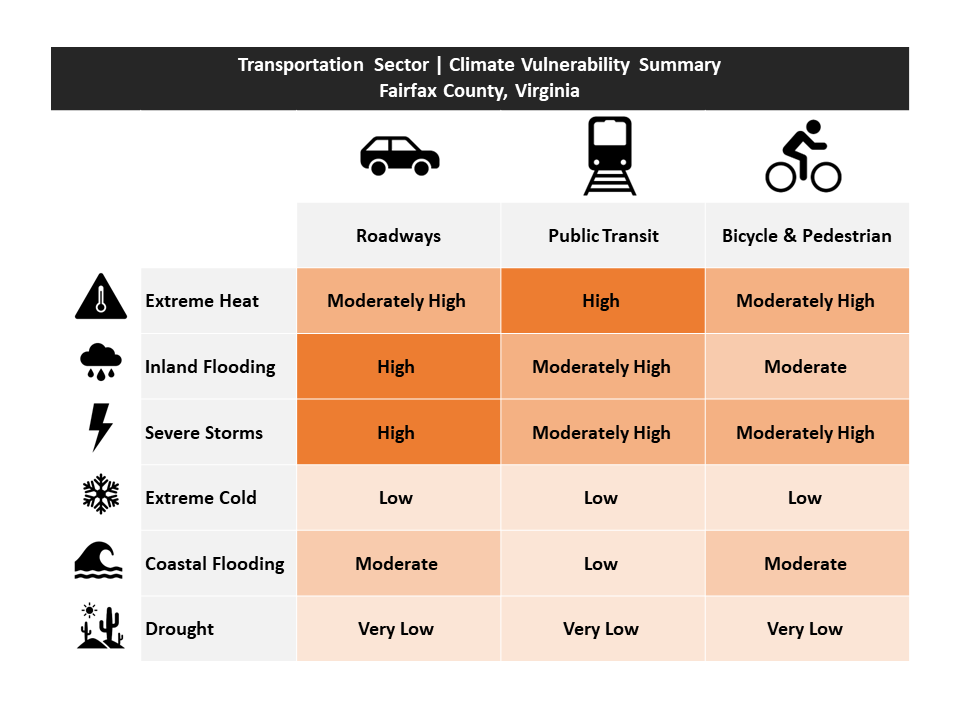
The table below provides an overview of the total climate vulnerability scores for Fairfax County’s roadways, public transit systems, and bicycle and pedestrian networks. These vulnerability scores were based on a combination of exposure (how exposed is the infrastructure to the hazard, and is that hazard increasing or decreasing?), sensitivity (when the infrastructure is exposed, does something bad happen?), and adaptive capacity (can the infrastructure adapt to changing conditions?). For a detailed description of vulnerabilities, please see the Climate Vulnerability and Risk Assessment. An interactive map of these natural resources and certain climate hazards can be found in the Resilient Fairfax Interactive Map Viewer.
Roadways, Bridges, and Electric Vehicle Infrastructure Vulnerabilities
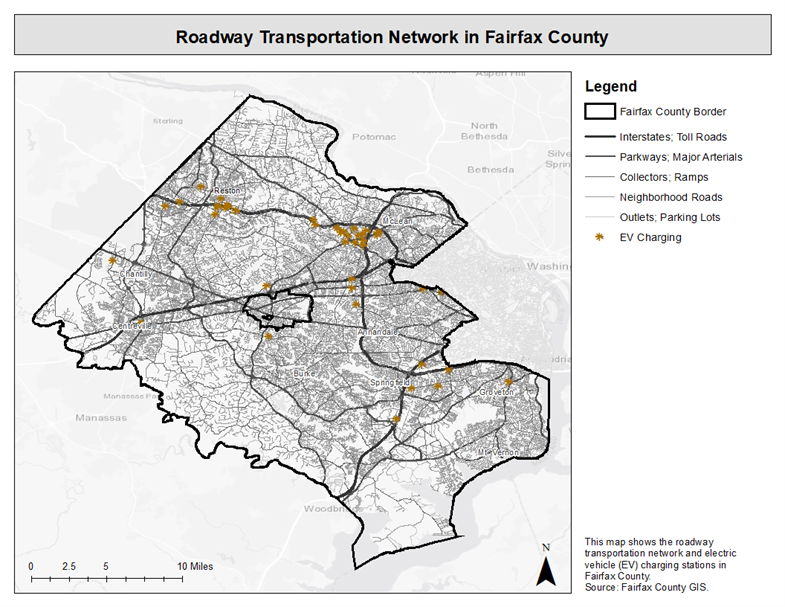
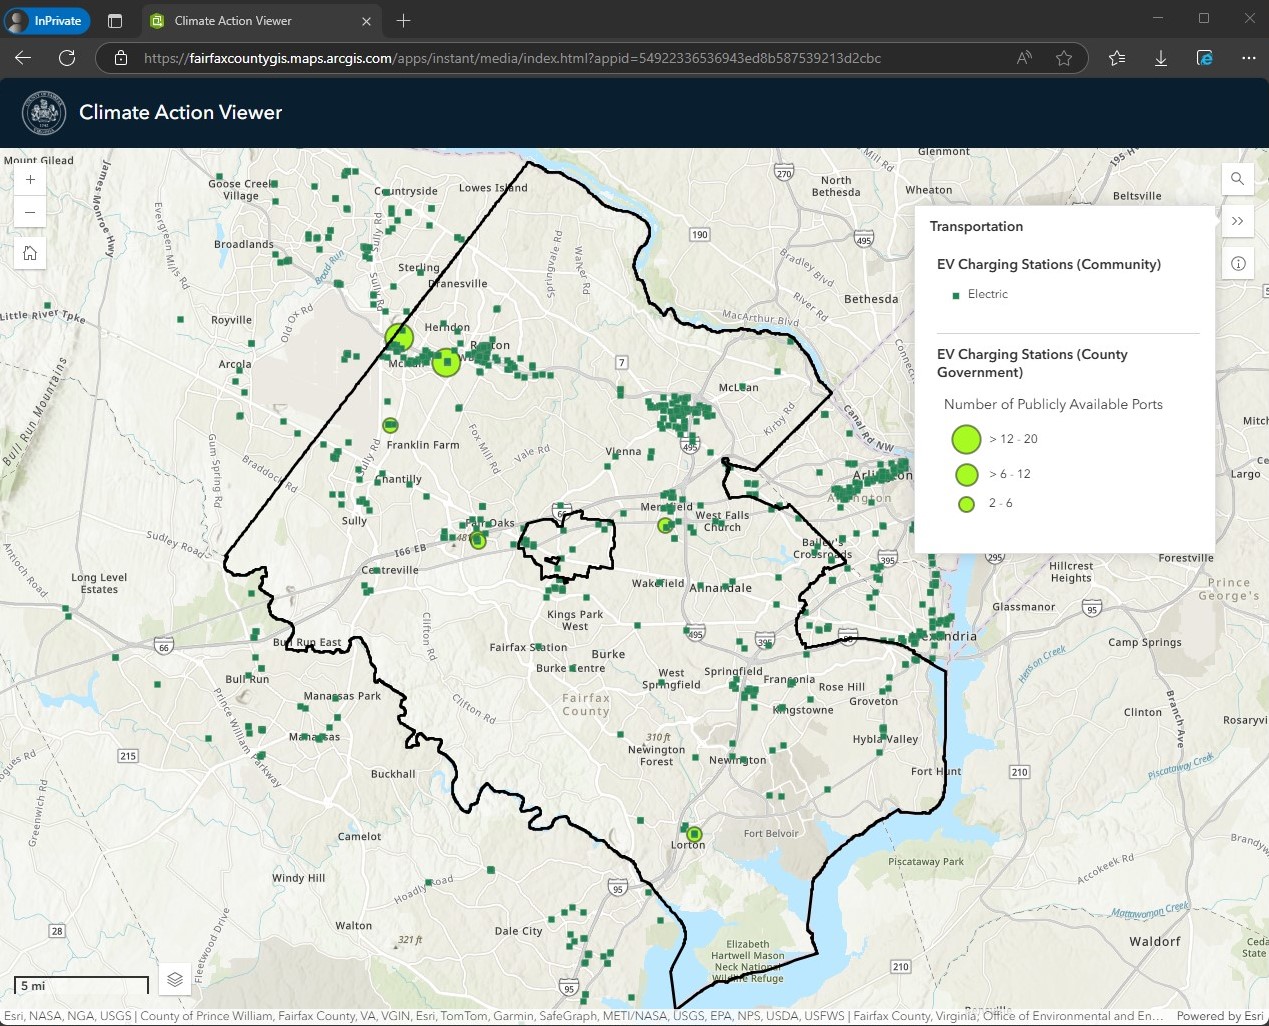
The roadway system in Fairfax County is largely owned and maintained by the Virginia Department of Transportation (VDOT). Very few public roads are owned by the Fairfax County Department of Transportation (FCDOT). The Dulles Toll Road is under the authority of the Metropolitan Washington Airports Authority. The George Washington Memorial Parkway is under the authority of the National Park Service. In addition to public roads, there are privately-owned and maintained roads throughout the county, as visualized in this map. Roadways, bridges, and EV charging stations have a moderately high vulnerability to extreme heat, and a high vulnerability to inland flooding and severe storms.
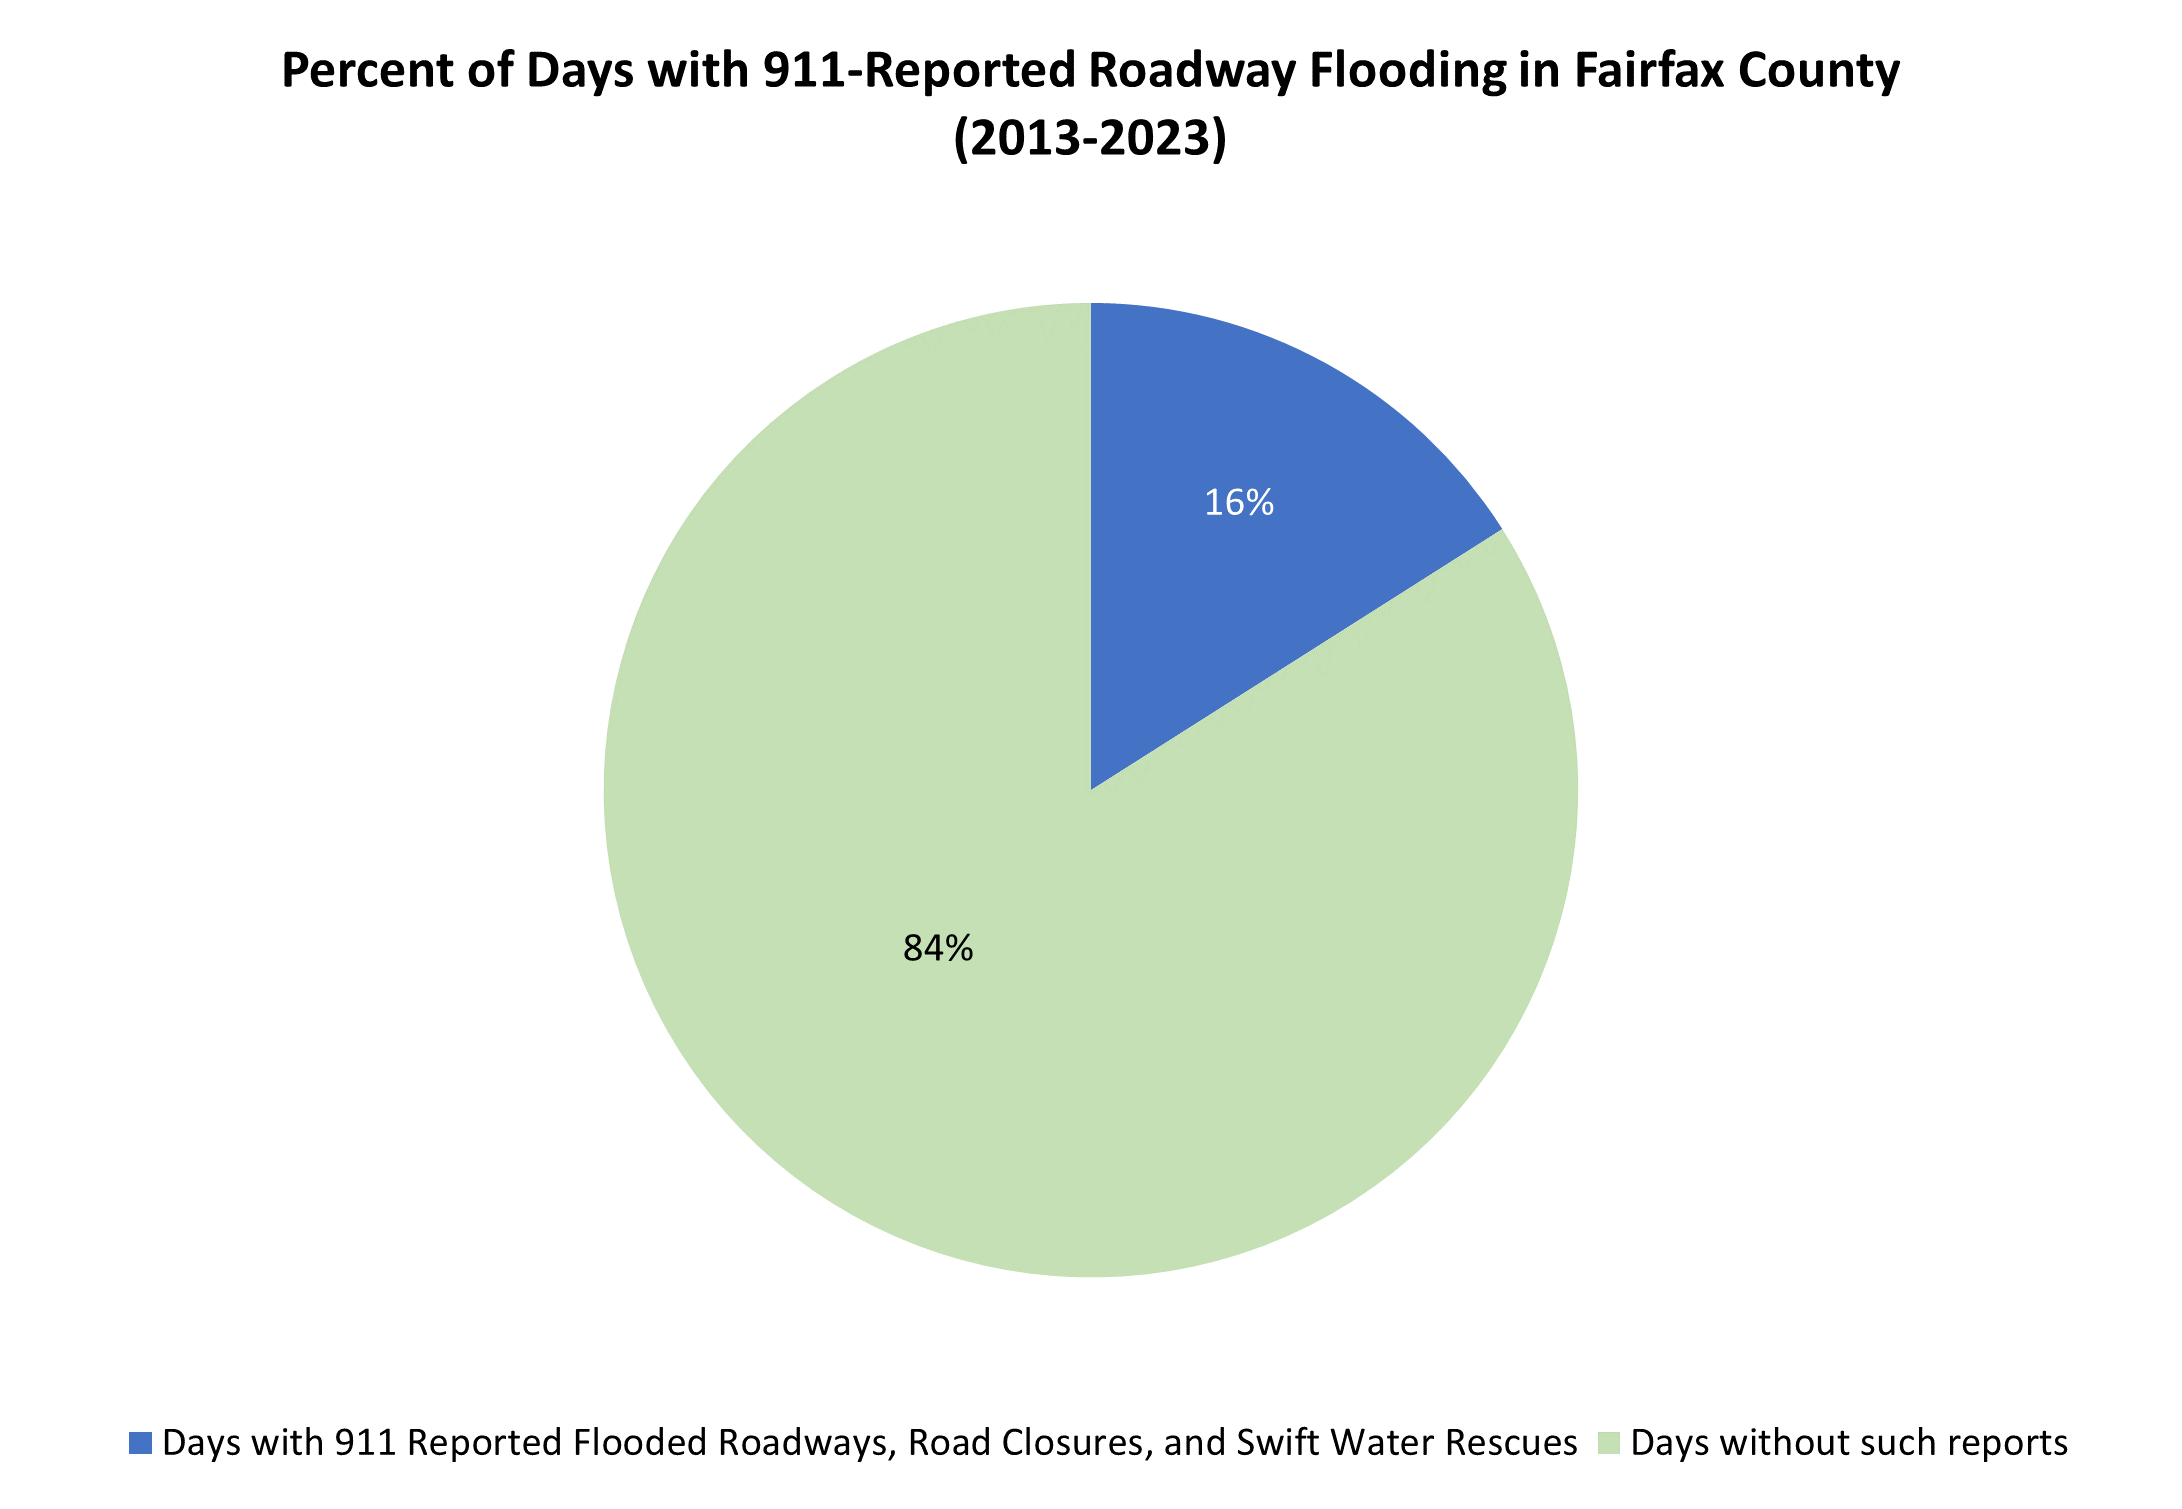
Roadways are highly vulnerable to flooding, which is one of the top hazards in Fairfax County. Roadway flooding, closures, and swift water rescues are reported in different ways. Data from 911 calls are one source of this information. In Fairfax County, between June 2013 and October 2023, (3,710 days), there were 576 days with 911 records of roadway flooding, including roadway closures, water-related hazards, and swift water rescues. This means that on average, 16% of days in Fairfax County have 911 calls related to roadway flooding.
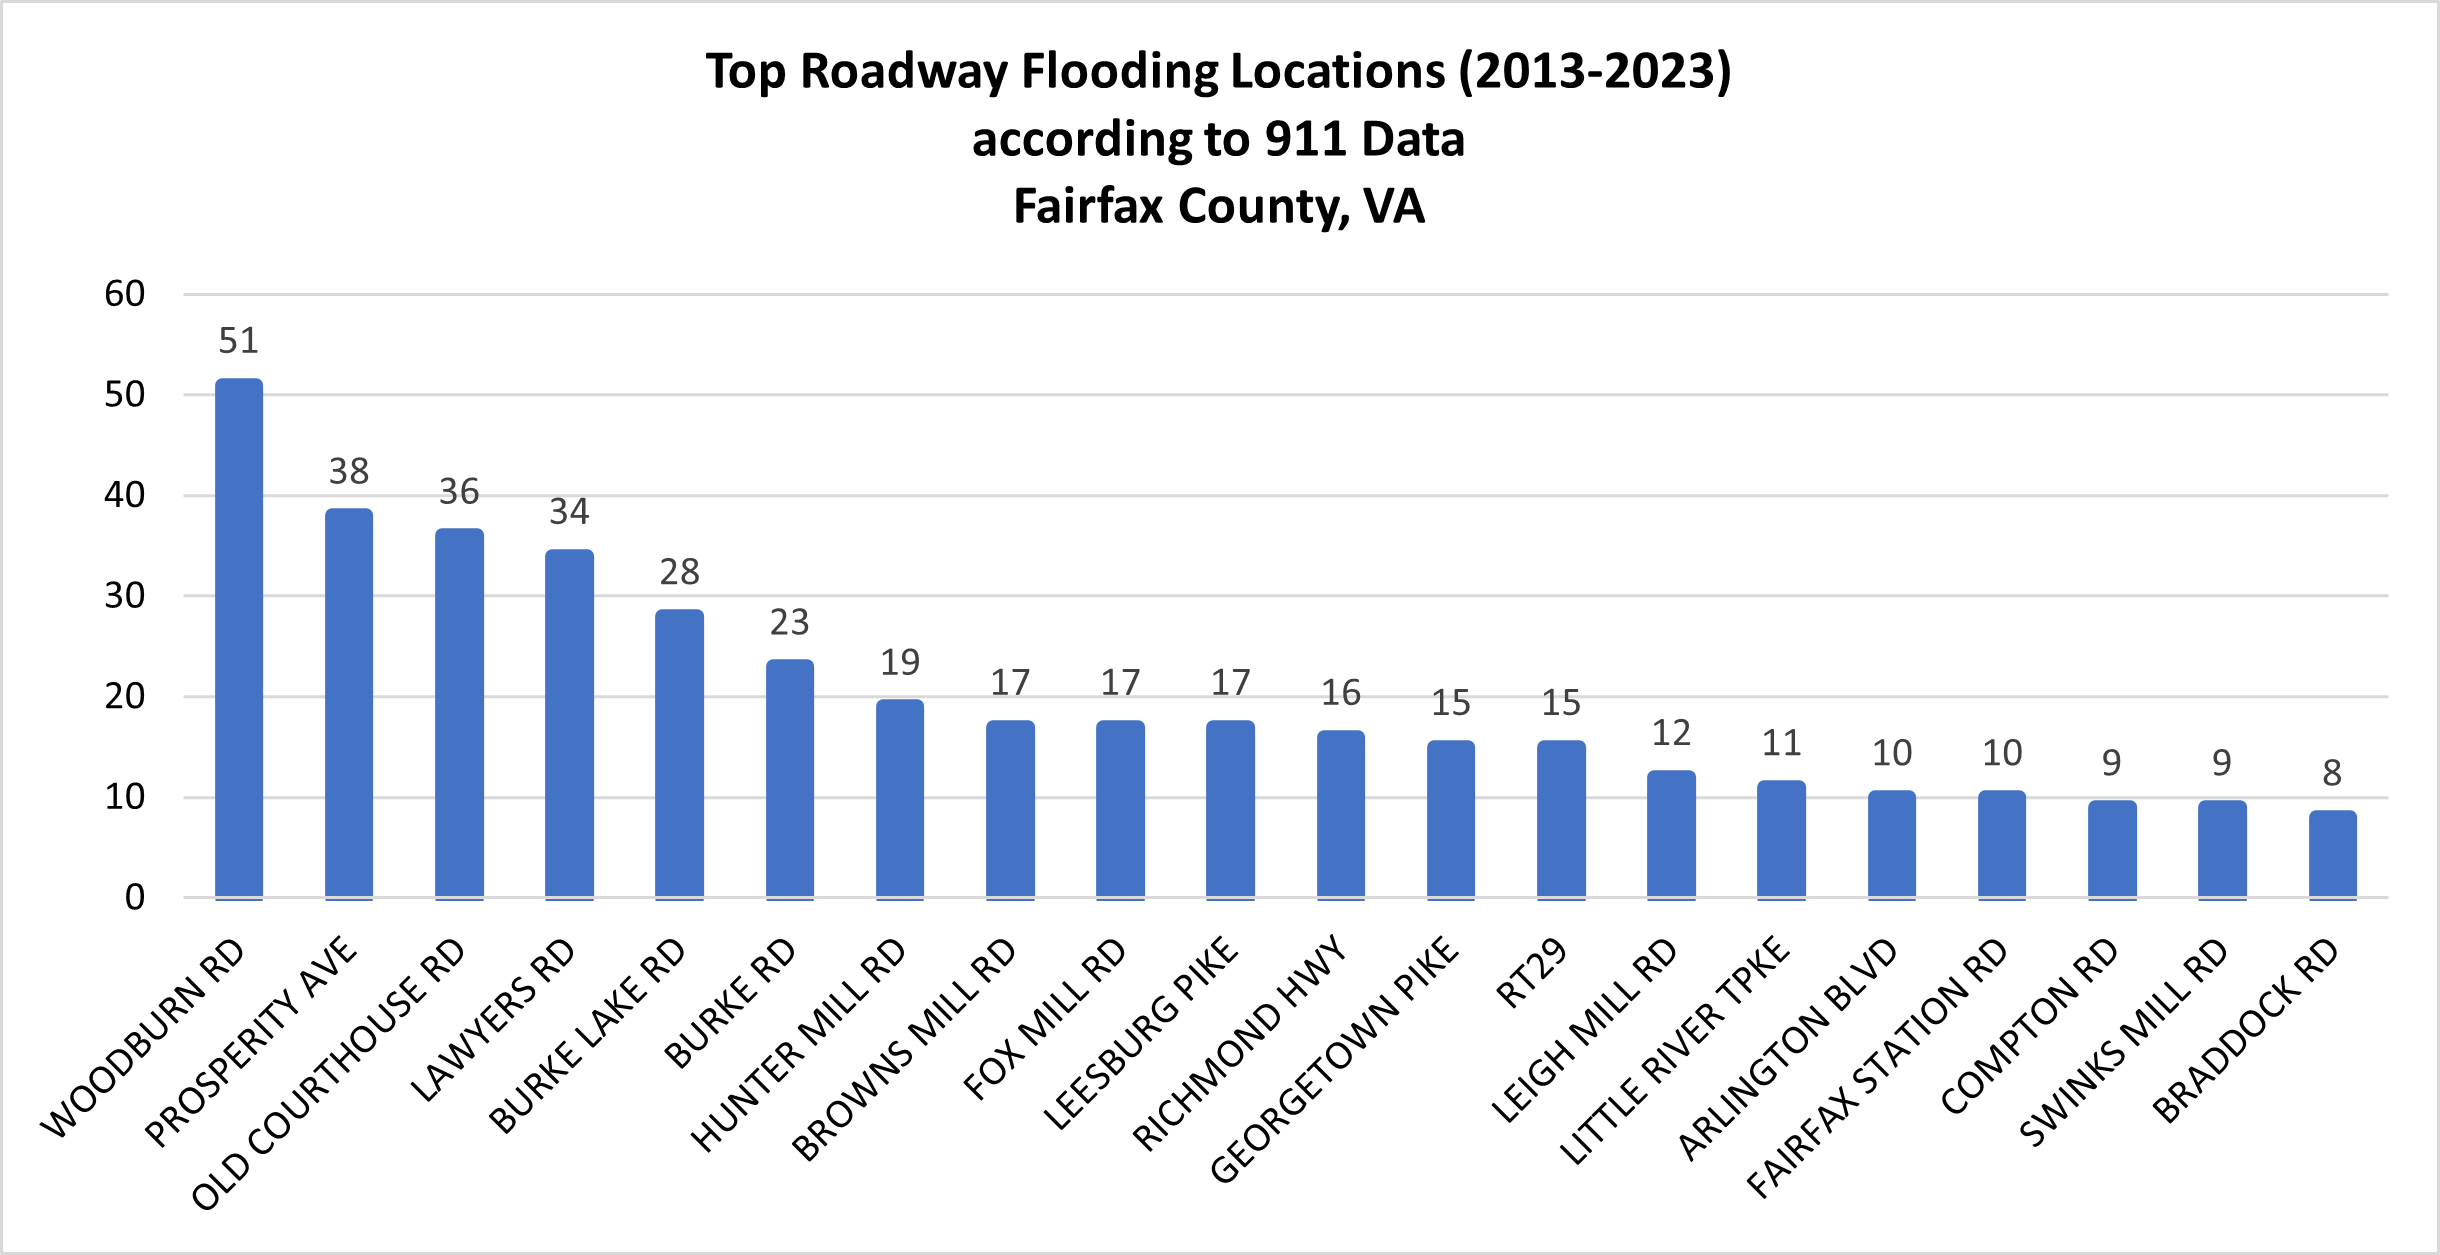
Certain roadways flood much more often than others. The graph here shows the top 20 roadways that appeared in 911 reports for flooding. (911 data courtesy of Fairfax County Departments of Emergency Management, Fire and Rescue, Police, and Public Safety Communications).
Flood-compromised roadways are a serious safety concern, increasing the risk of road accidents, drownings, and reduced ability for emergency personnel to deliver aid. In addition to the vulnerabilities of the people using the transportation infrastructure, (which is the top priority), transportation infrastructure itself is sensitive to flooding. Flooding of roadways and bridges can cause erosion, structural failure, deterioration, debris, and overflowing of drainage systems, inflicting damage on surrounding environments and compromising road safety.
Fairfax County prioritizes flood-prone areas for flood risk reduction and transportation improvement projects. For example, Old Courthouse Road is one of the top flooding locations, and it is currently being upgraded to reduce flood risk and other issues. (See the Old Courthouse Road Realignment Project here). For an interactive map of several flooding types, please see the Resilient Fairfax Interactive Map Viewer.
Transportation Infrastructure and Extreme Heat
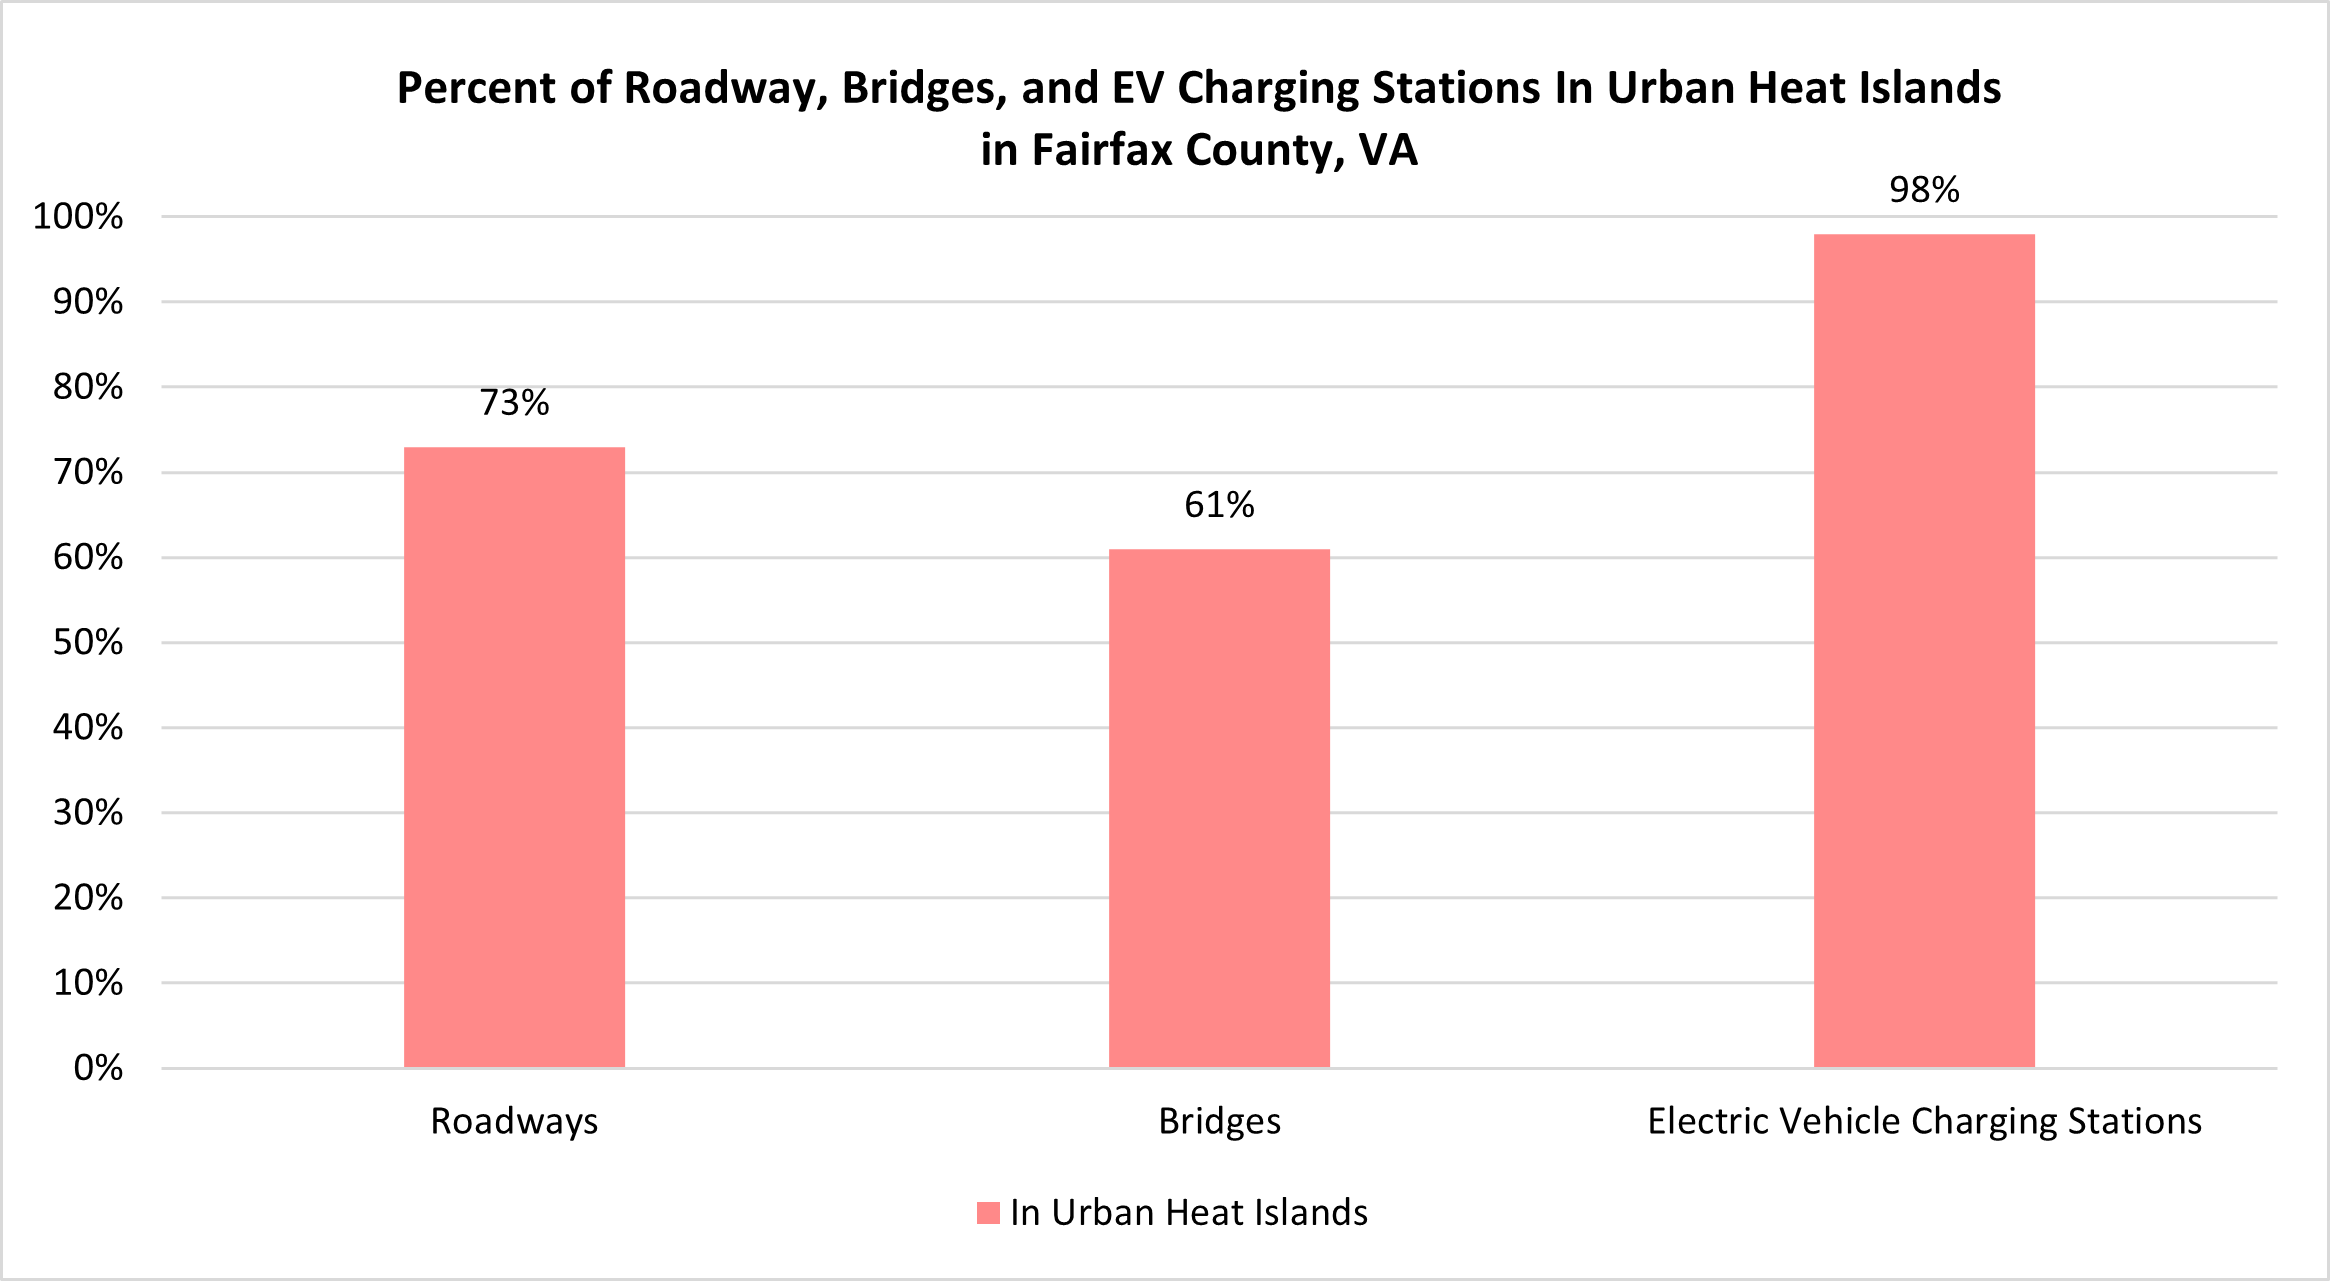
Extreme heat is another top vulnerability for roadways, bridges, and electric vehicle infrastructure. 73% of roadway miles, 61% of bridges, and 98% of electric vehicle charging stations are in Urban Heat Islands, where land surface temperatures are significantly hotter. This is partially because transportation infrastructure itself (such as asphalt) can increase the Urban Heat Island effect by staying much hotter than green space. However, these heat islands also create vulnerabilities for the infrastructure itself.
Exposure to higher temperatures can damage and degrade transportation infrastructure more quickly, causing pavement to crack and EV chargers to malfunction. Most electric vehicle chargers operate optimally between -13F and 104F and can become dangerous in higher temperatures and humidity that is conducive to electrical arcs.
The map here shows an urban heat island with transportation infrastructure from the Resilient Fairfax Interactive Map Viewer. For additional roadway vulnerabilities, including those related to severe storms, please see the Vulnerability and Risk Assessment. For information on what the county is doing to boost resilience, please see the Resilient Fairfax plan.

Public Transportation and Rail Vulnerabilities
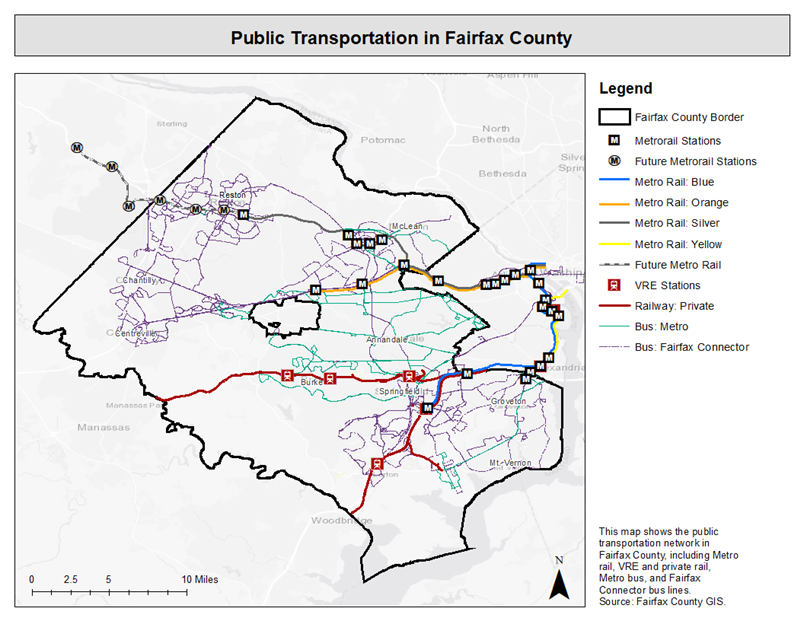
Public transportation infrastructure in Fairfax County includes but is not limited to Metrorail and Metrorail stations, Metrobus lines and Metrobus stops, Fairfax Connector bus stops, private railways, and Virginia Railway Express (VRE) stations. In addition to these assets within the county, the Dulles International Airport, located just outside of the Fairfax County border, is the largest airport in Virginia and a major international airport for the Greater Washington region.
This map shows the public transportation infrastructure in Fairfax County. Public transportation infrastructure has a high vulnerability to extreme heat, and moderately high vulnerability to flooding and severe storms.
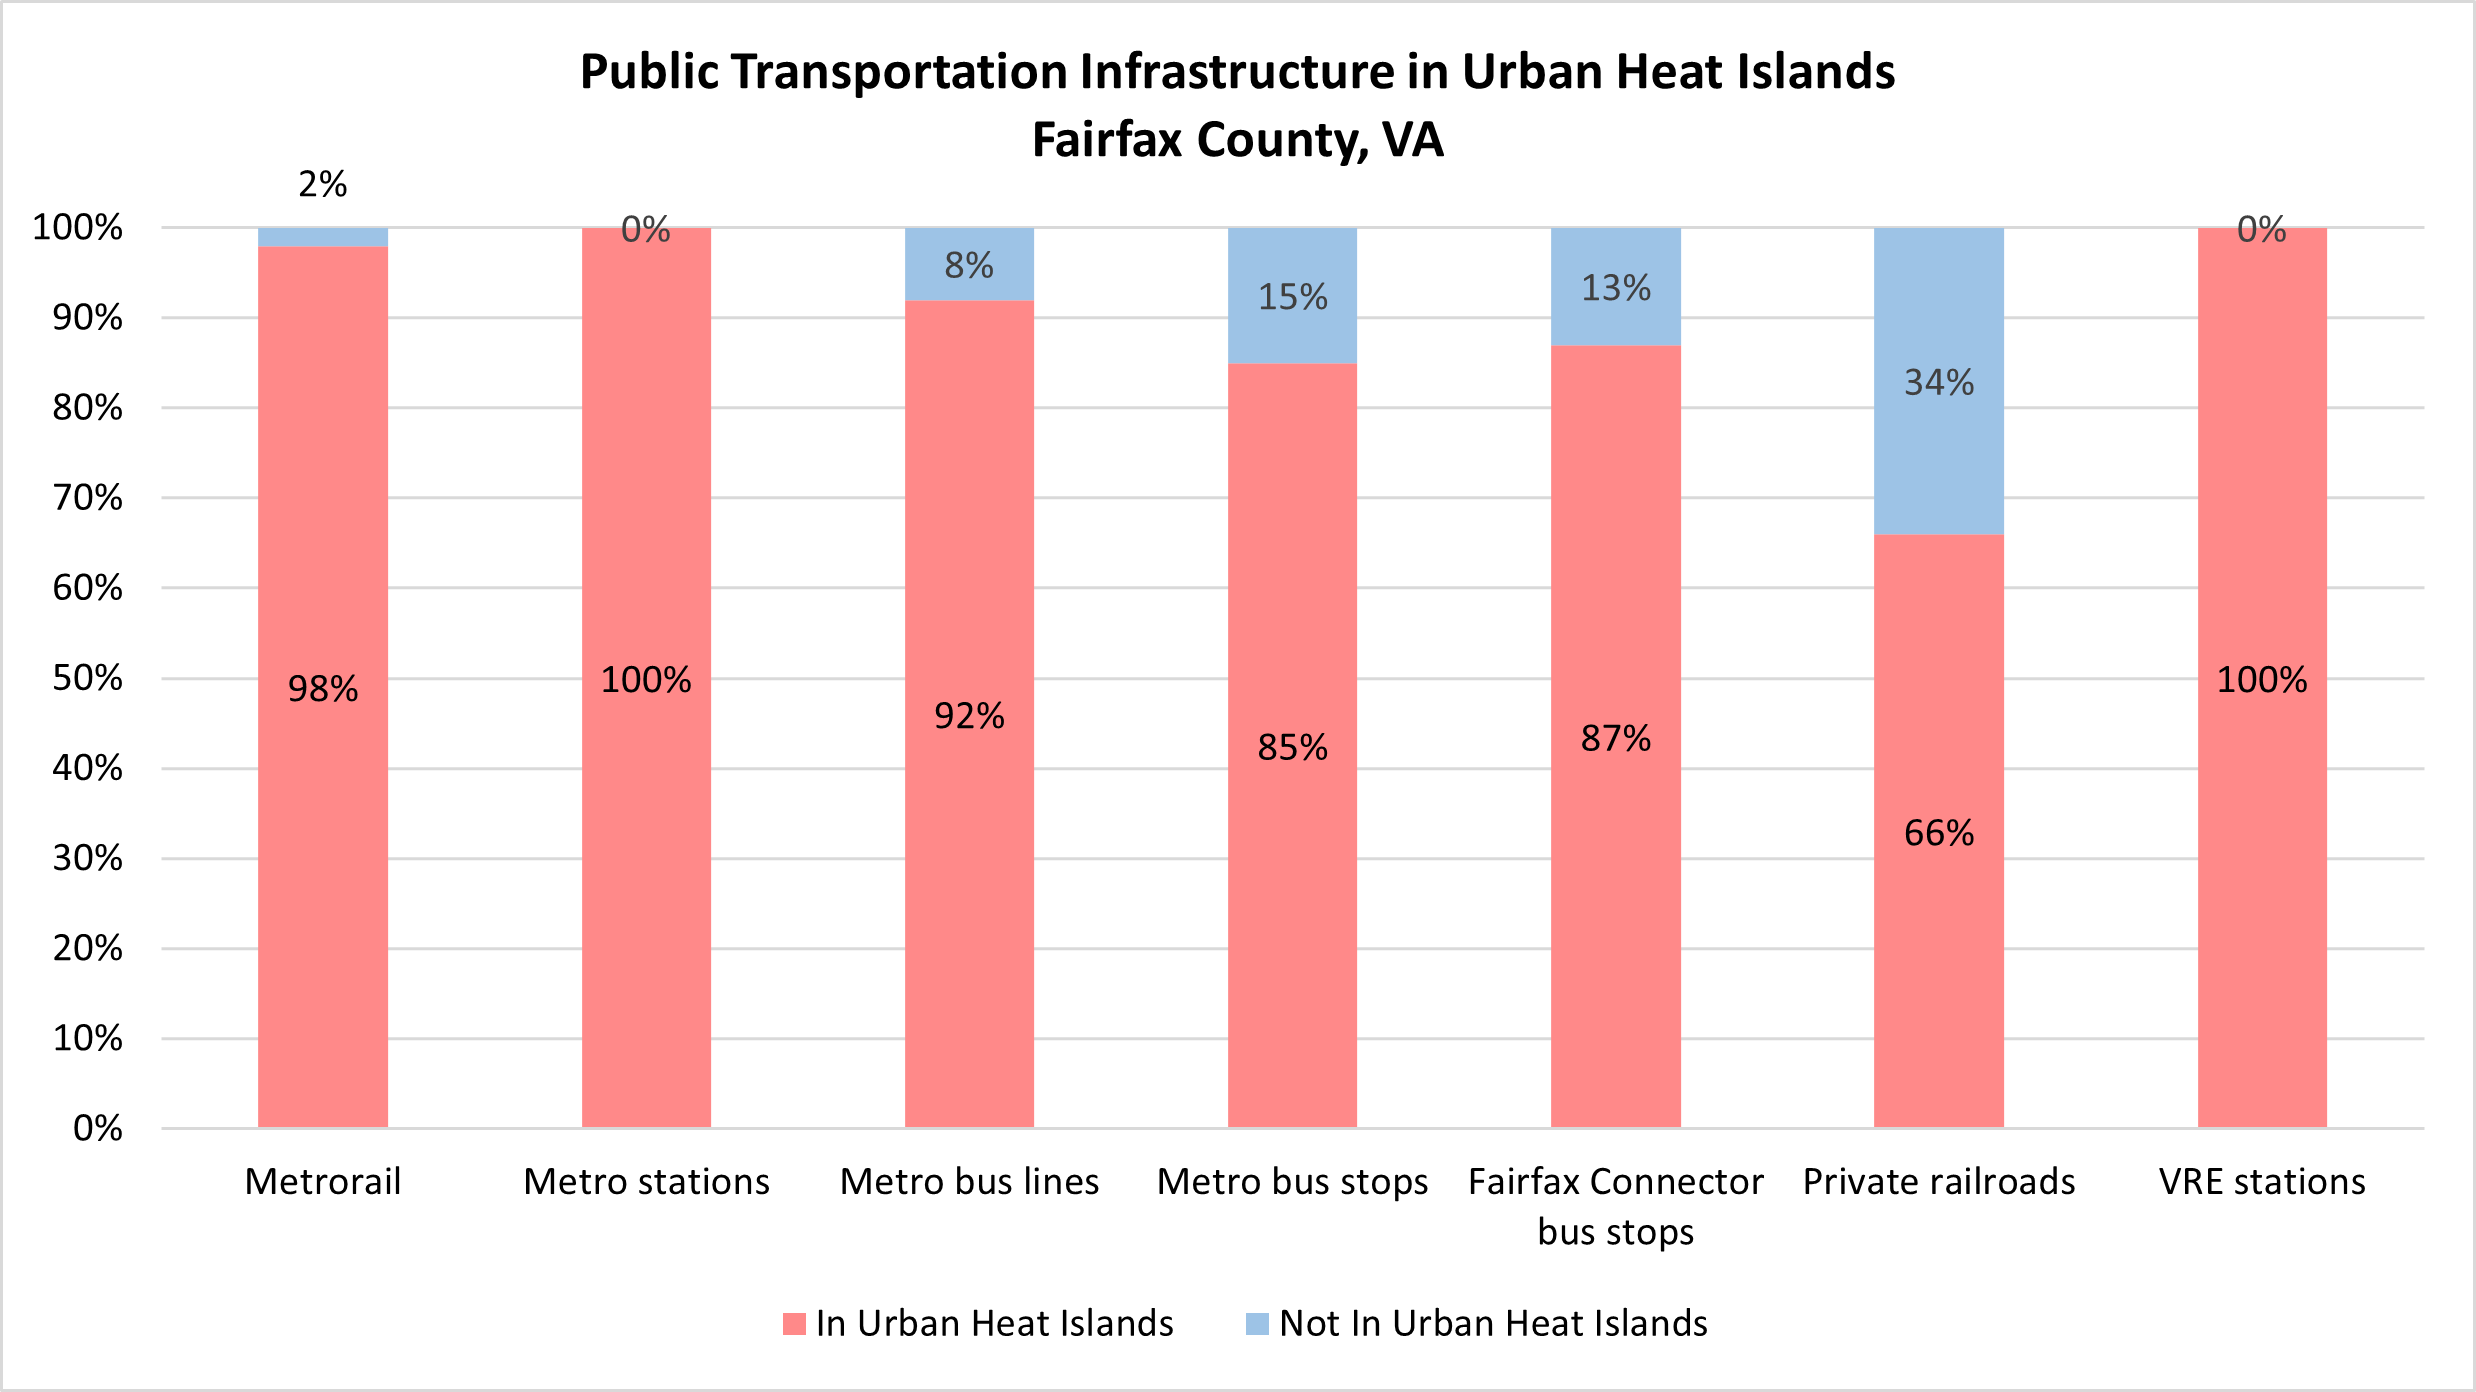
In terms of extreme heat, the public transportation system and its riders have high exposure, high sensitivity, and moderate capacity to adapt. While all above-ground infrastructure is exposed to extreme heat when it occurs, infrastructure in Urban Heat Islands (UHIs) are even more exposed than infrastructure in cooler areas.
As summarized in the chart above, 98% of Metrorail, 100% of Metro stations, 92% of Metro bus lines, 85% of Metro bus stops, 87% of Fairfax Connector bus stops, 66% of private railroads, and 100% of VRE stations in Fairfax County are in areas with high Urban Heat Island effect.
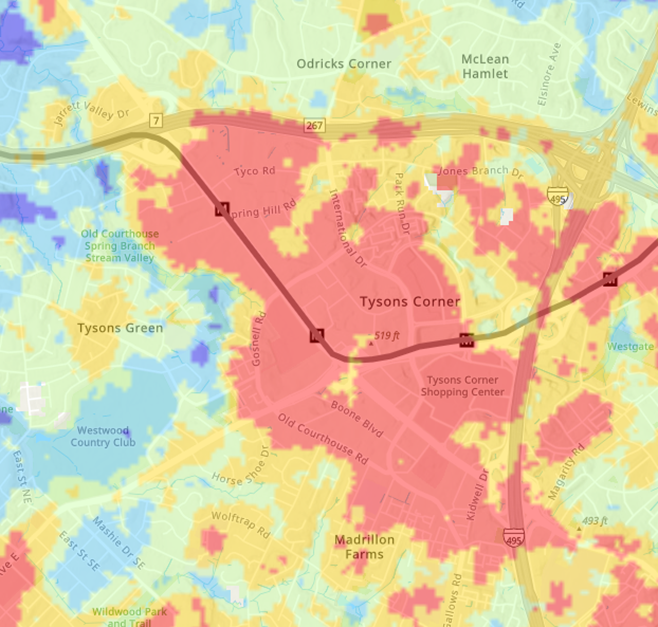
The map above shows one example of an urban heat island, in Tysons Corner (where average summer land surface temperatures exceed 108F), and three metro stations within the higher temperature area. (Please see Resilient Fairfax Interactive Map Viewer)
Temperatures over 100F (which is common in these Urban Heat Islands in the summer) can buckle railroad tracks, causing repair-related delays and reduced train speeds. Heat can also interfere with voltage, causing loss of service to Metrorail. Battery Electric Buses operate optimally between 59F and 95F, so can experience issues during extreme heat. Airport operations are also sensitive to extreme heat because the asphalt on runways softens and the air becomes less dense, making it more difficult for airplanes to take off. Most importantly, extreme heat can cause heat-related illnesses for those who use and wait outdoors for public transit.
In terms of flooding, the public transportation and railway infrastructure in Fairfax County has moderately high vulnerability. The good news is that most Metro stations in Fairfax County are located above ground, making them less exposed to flooding than the underground stations in neighboring Arlington and Washington, DC. A small percentage of public transportation infrastructure crosses through FEMA or county floodplains (less than 5% for most infrastructure types).
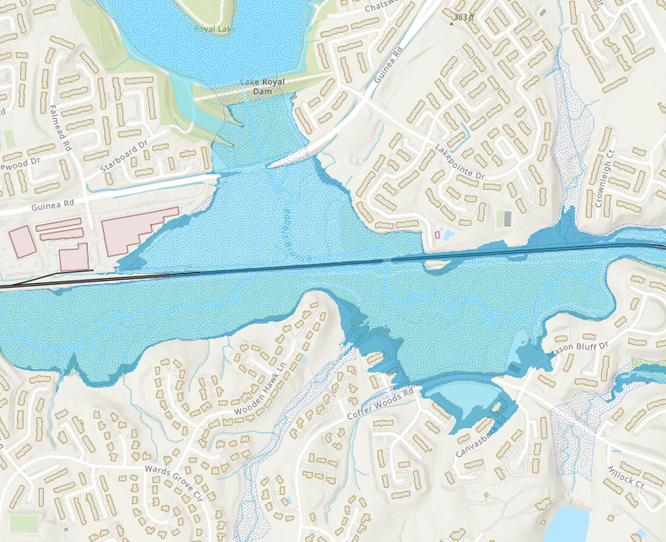
For example, the map below shows a segment of Norfolk Southern railway that crosses through the floodplain near the Lake Royal Dam. (See Resilient Fairfax Interactive Map Viewer). Outside of flooding, public transportation and railway infrastructure can have a high exposure to urban and flash flooding.
For additional public transportation and rail vulnerabilities and details, please see the Vulnerability and Risk Assessment. For information on what the county is doing to boost resilience, please see the Resilient Fairfax plan.
Bicycle and Pedestrian Infrastructure Vulnerabilities
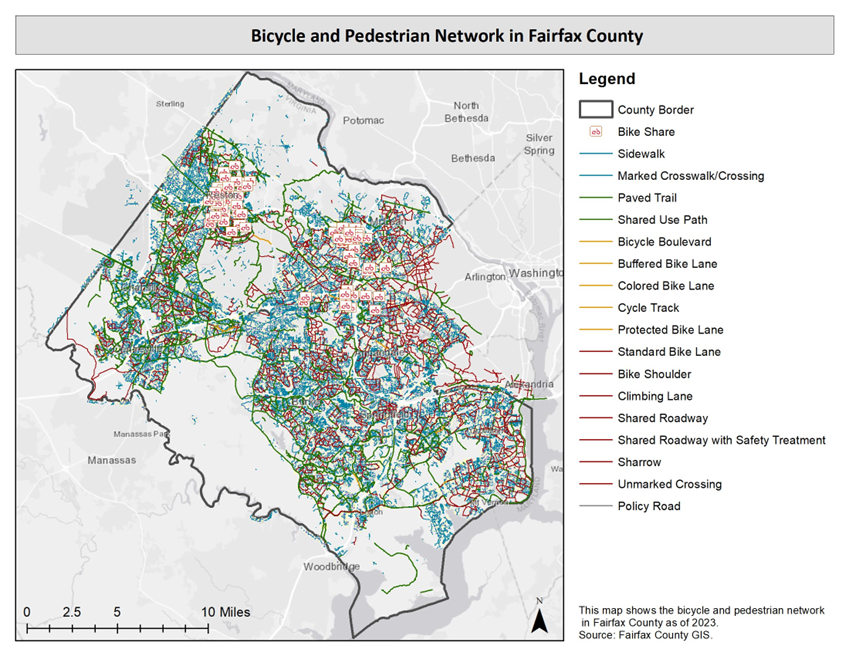
As illustrated in the map below there are approximately 1,580 miles of bicycle routes (including bicycle routes on roadways), 950 miles of bicycle trails, and 4,106 miles of pedestrian walkways in Fairfax County. There are over 54 Capital Bikeshare stations, which are largely concentrated in the north part of the county near Metro stations.
Multiple stakeholders maintain bicycle and pedestrian infrastructure, including the Virginia Department of Transportation (VDOT), Fairfax County Department of Transportation (FCDOT), Department of Public Works and Environmental Services (DPWES), Facilities Management Department (FMD), Fairfax County Public Schools (FCPS), Northern Virginia Regional Park Authority (NVRPA), private landowners and homeowners’ associations, and others.
For more information on the bicycle and pedestrian network in general, please see the Fairfax County Department of Transportation webpage. Bicycle and pedestrian networks have a moderately high vulnerability to extreme heat and severe storms, and a moderate vulnerability to inland flooding and coastal flooding.
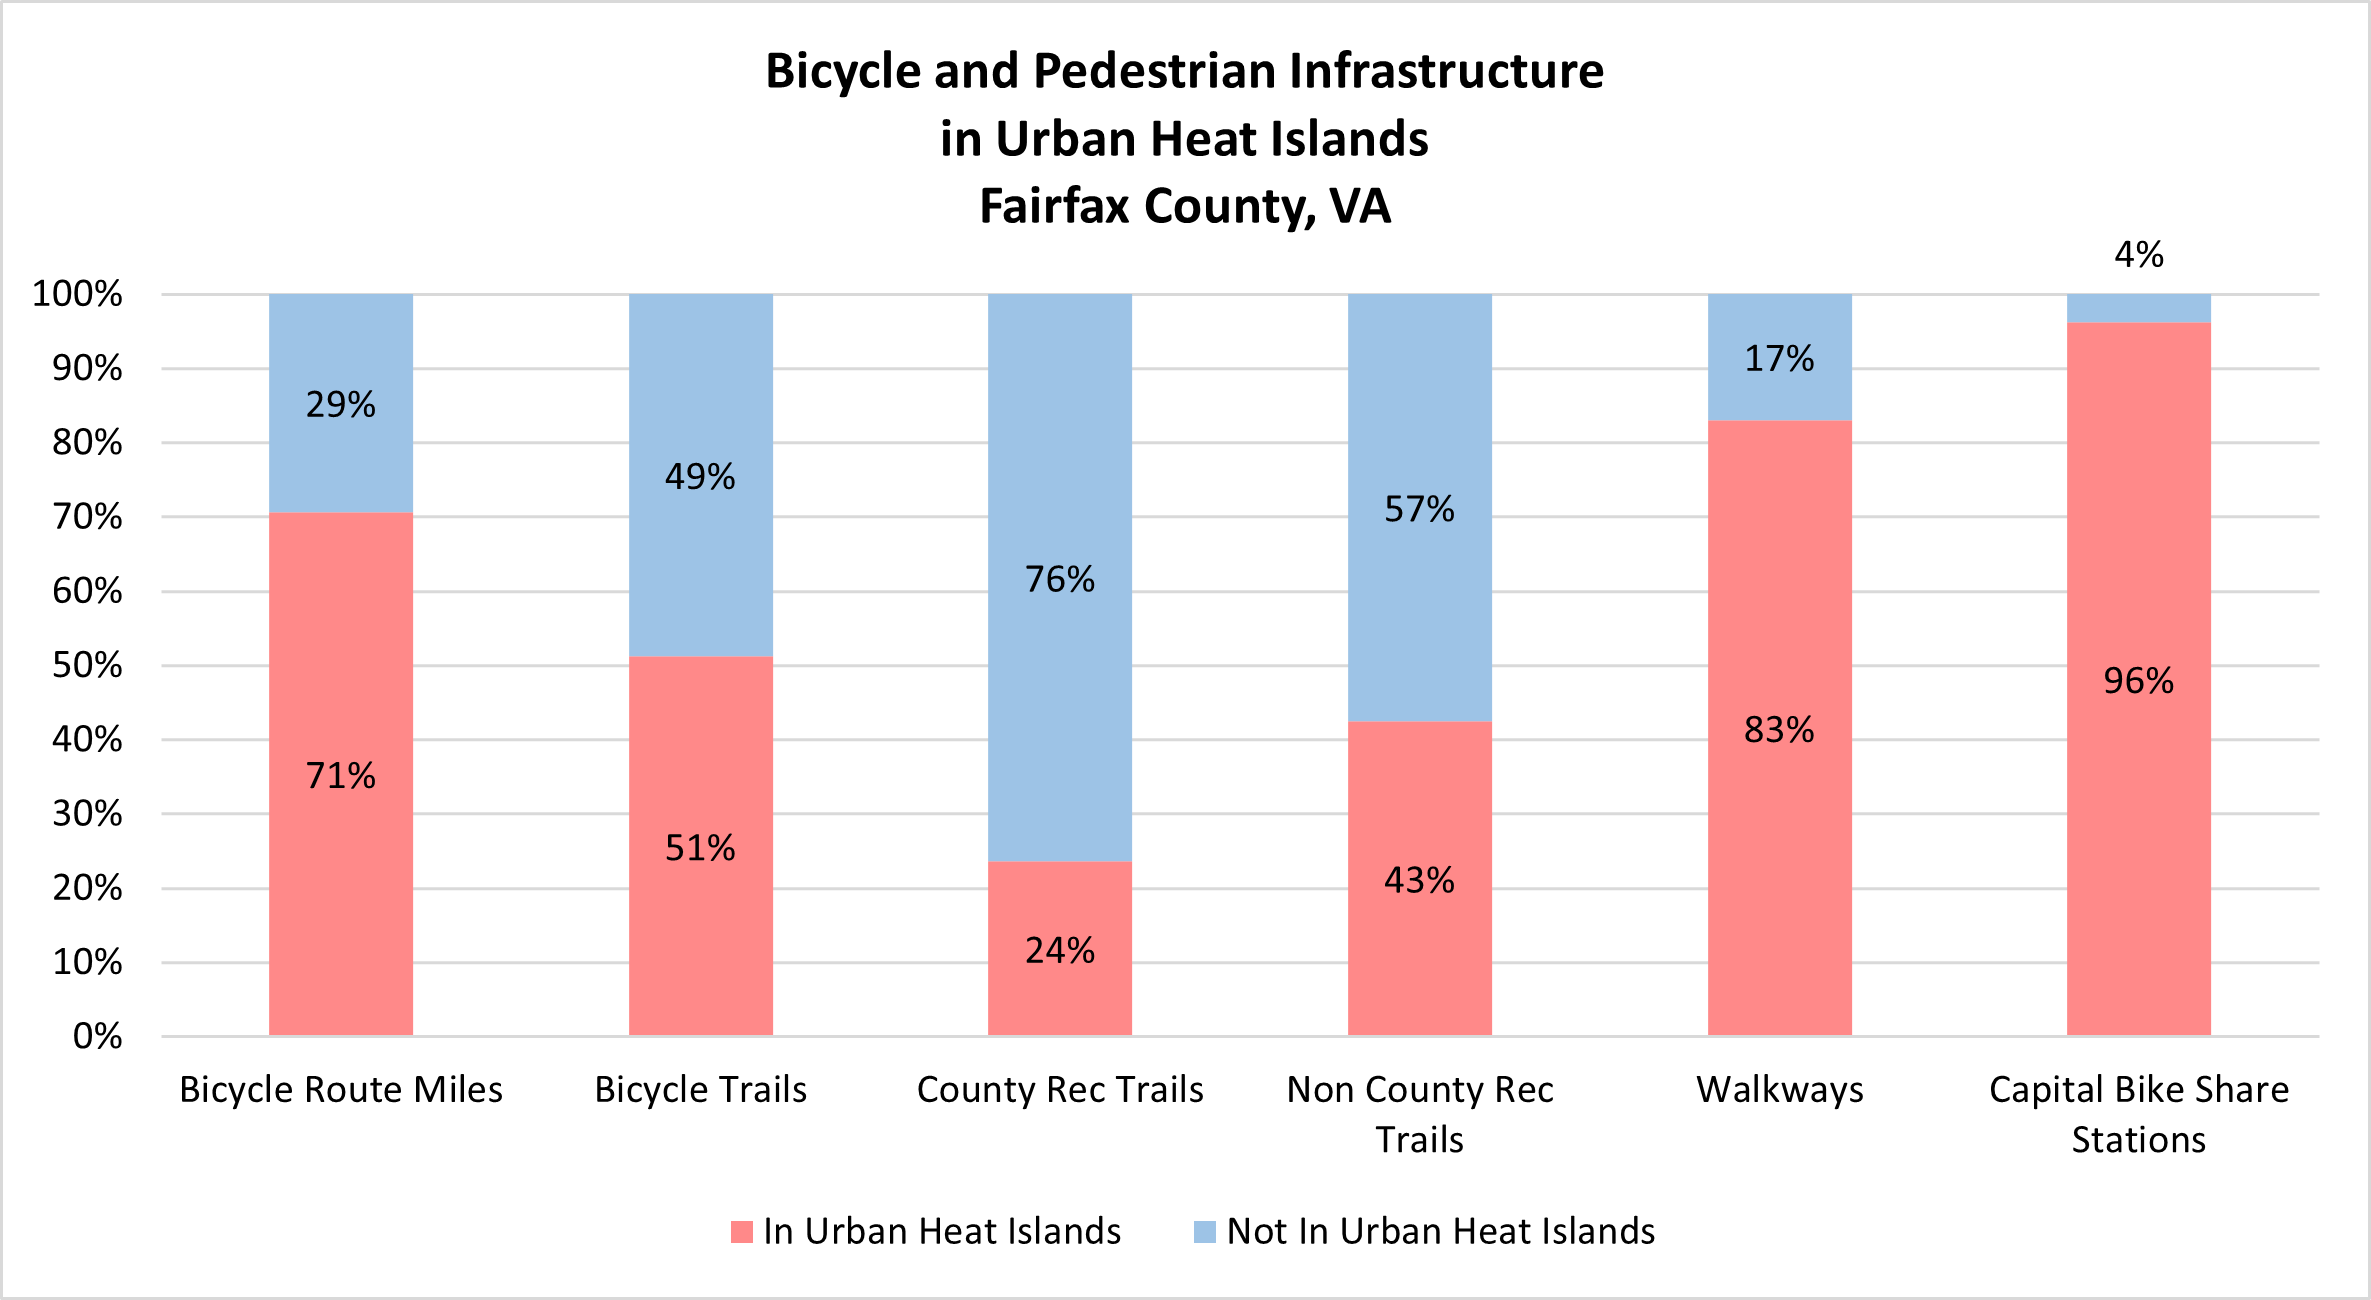
The full bicycle and pedestrian network and its users are exposed to high temperatures when they occur, but those located in Urban Heat Islands face significantly higher temperatures than others. Over 70% of bicycle route miles, 51% of bicycle trails, 83% of walkways, and 96% of Capital Bike Share stations are in high Urban Heat Islands.
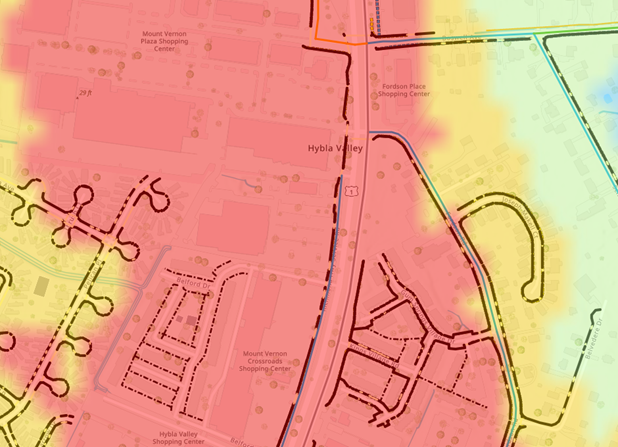
For example, the map below shows an Urban Heat Island in the Hybla Valley area, where average land surface summer temperatures exceed 115F. Those without access to vehicles who rely on walking and biking are especially exposed. (Please see Resilient Fairfax Interactive Map Viewer)
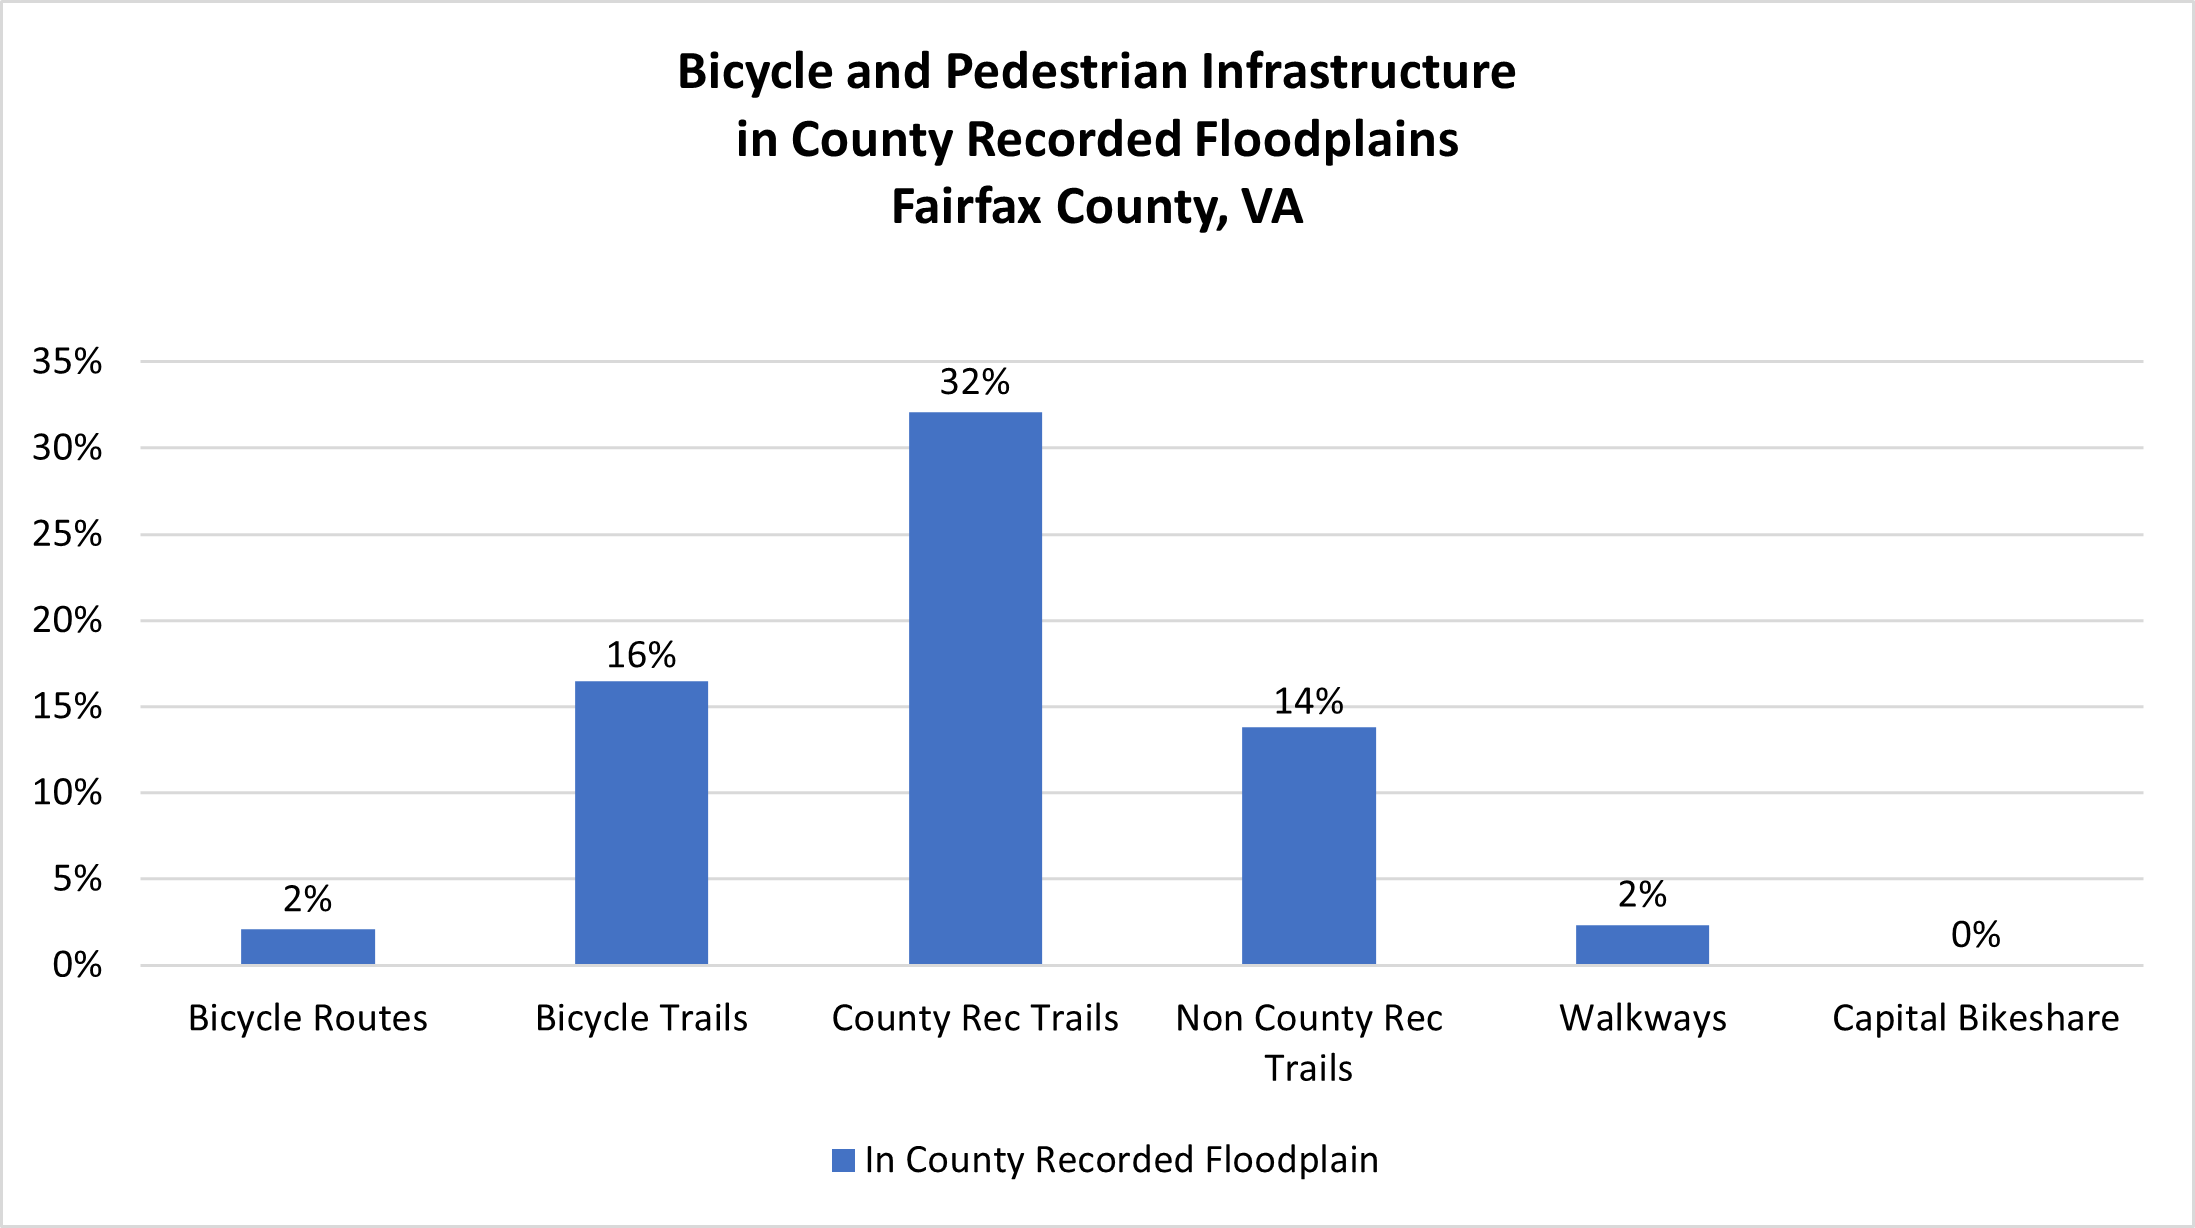
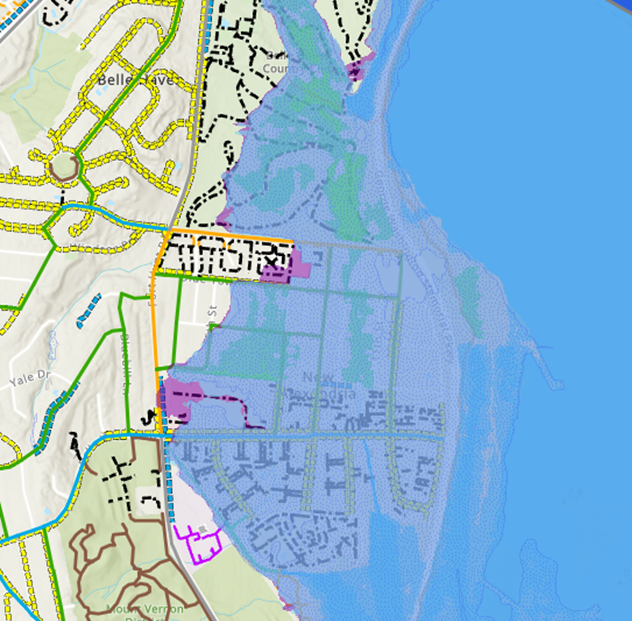
In terms of flooding, over 16% of bicycle trails, 2% of bicycle routes, and 2% of walkways are in county recorded floodplains. This is especially an issue for trails along the Potomac River, as illustrated in the map screenshot of New Alexandria below from the Resilient Fairfax Interactive Map Viewer. In addition to floodplain exposure, bicycle and pedestrian routes are exposed to urban flooding, where heavy precipitation floods roadways. (Please see Roadway flooding). Severe heavy precipitation events have required swift water rescues. Flooding can also erode and degrade trails and render them inaccessible.
This section of the dashboard highlighted a few key metrics relevant to transportation and climate resilience. For more information on resilience data and projections, please see the Overall Resilience Metrics page. For an interactive map of climate hazards and assets, please see the Resilient Fairfax Interactive Map Viewer. For more information on vulnerabilities, please see the Resilient Fairfax Climate Vulnerability and Risk Assessment (VRA). For more information on Resilient Fairfax and what Fairfax County is doing to address these issues, please see the Resilient Fairfax website.


 Vehicle electrification is CECAP’s primary strategy to reduce mobile emissions. Unlike conventional vehicles, electric vehicles do not emit greenhouse gas emissions and short-lived air pollutants that are recognized environmental and public health hazards. EVs also use less energy per mile driven than conventional gasoline-powered vehicles due to the higher efficiency of their electric motors.
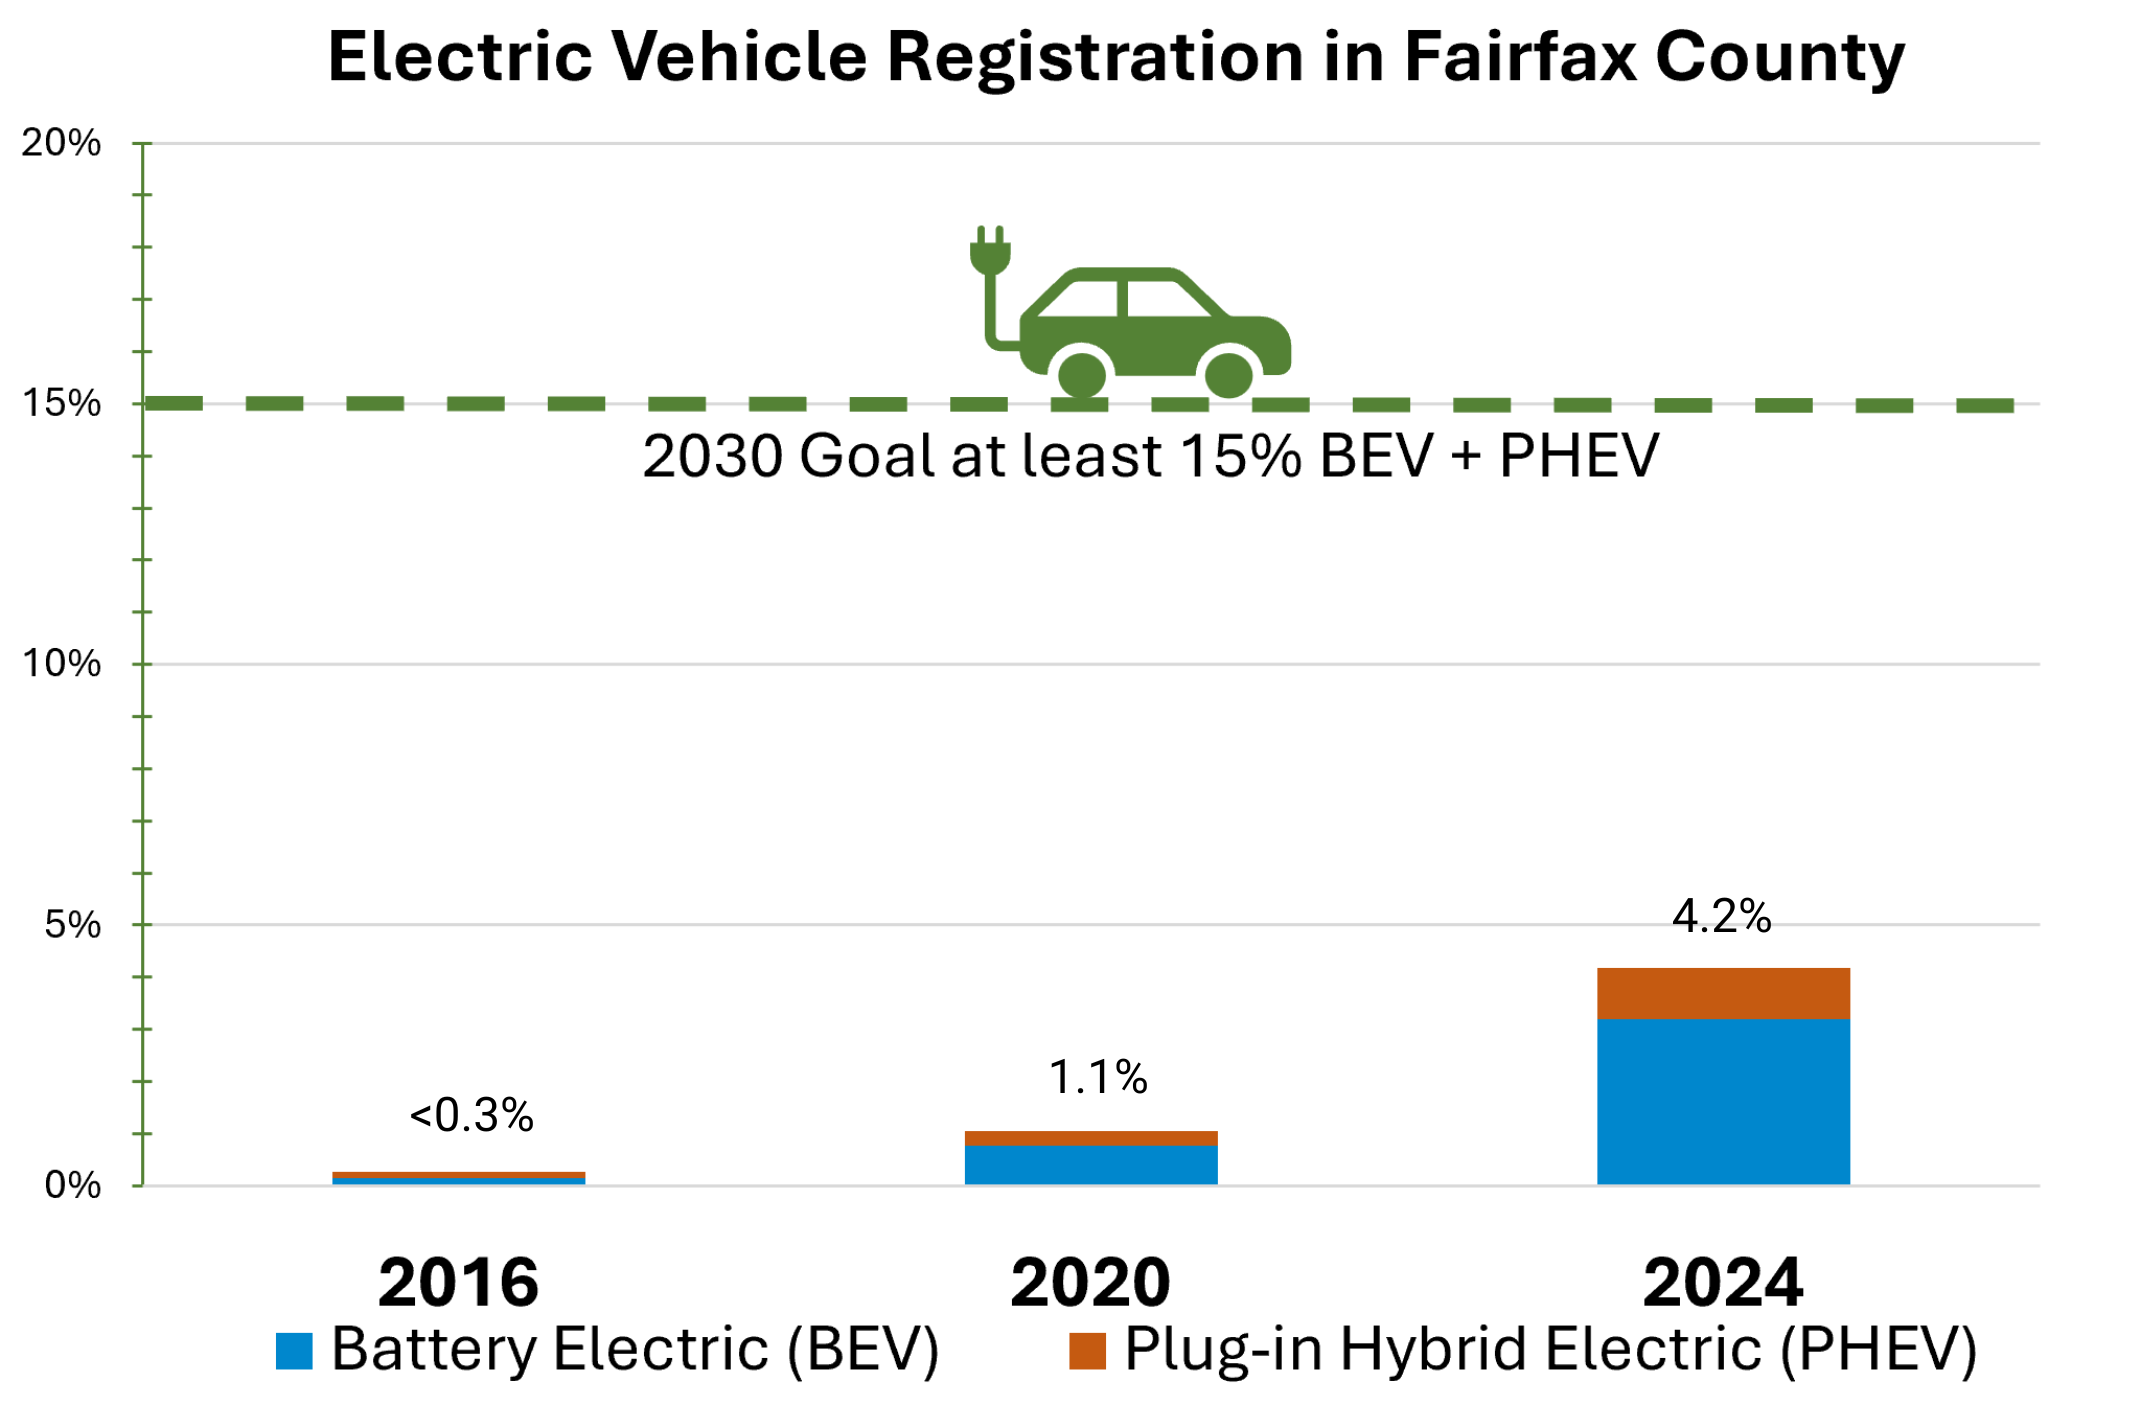
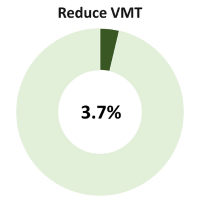 CECAP promotes sustainable mobility and identifies three major pathways to reducing Vehicle Miles Traveled (VMT), particularly by single-occupancy vehicles. This strategy accounts for 3.7% of the emissions reduction needed to meet the 2050 CECAP goal. To achieve VMT reductions, CECAP supports:
 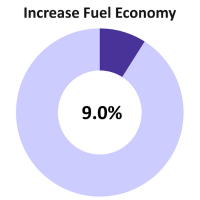 COMMUNITY (CECAP) GOAL: CECAP aims to reduce mobile emissions by supporting increases in both vehicle fuel economy standards and the use of low-carbon fuels for transportation. This strategy accounts for 9% of the emissions reduction needed to meet the 2050 CECAP goal.