RESILIENCE METRICS FOR ENERGY SUPPLY AND TELECOMMUNICATIONS
Our energy and telecommunications infrastructure can be vulnerable to certain climate-related shocks and stressors, such as increases in extreme heat, flooding, and severe storms. It is important to address these vulnerabilities because our homes, schools, businesses, infrastructure, and services depend on reliable energy and communications.
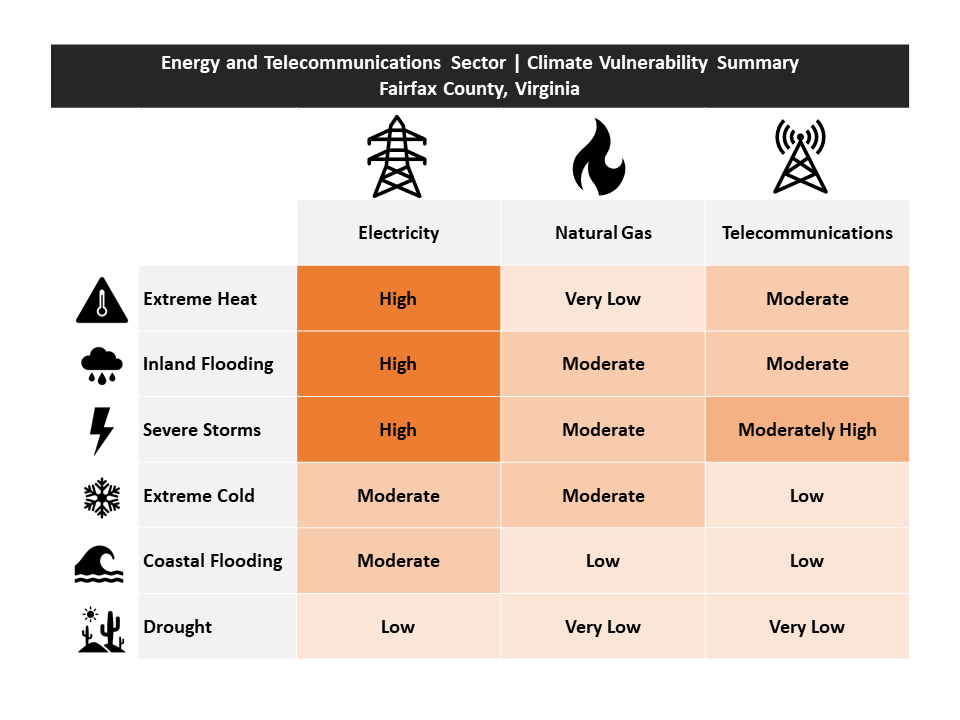
The table below provides an overview of the total climate vulnerability scores for Fairfax County’s electricity grid, natural gas infrastructure, and telecommunications infrastructure. These vulnerability scores were based on a combination of exposure (how exposed is the infrastructure exposed to the hazard, and is that hazard increasing or decreasing?), sensitivity (when the infrastructure is exposed, does something bad happen?), and adaptive capacity (can the infrastructure adapt to changing conditions?).
Electricity Infrastructure Vulnerabilities
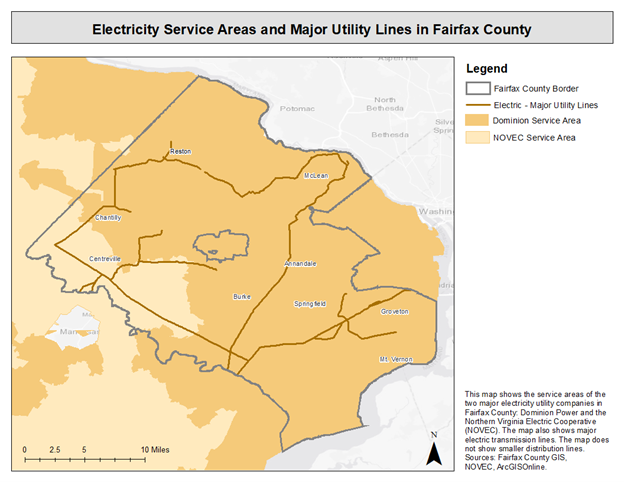
Fairfax County residents receive electricity service from either Dominion Energy or the Northern Virginia Electric Cooperative (NOVEC). The map below shows the locations of major electricity transmission lines, and the locations of Dominion and NOVEC service areas.
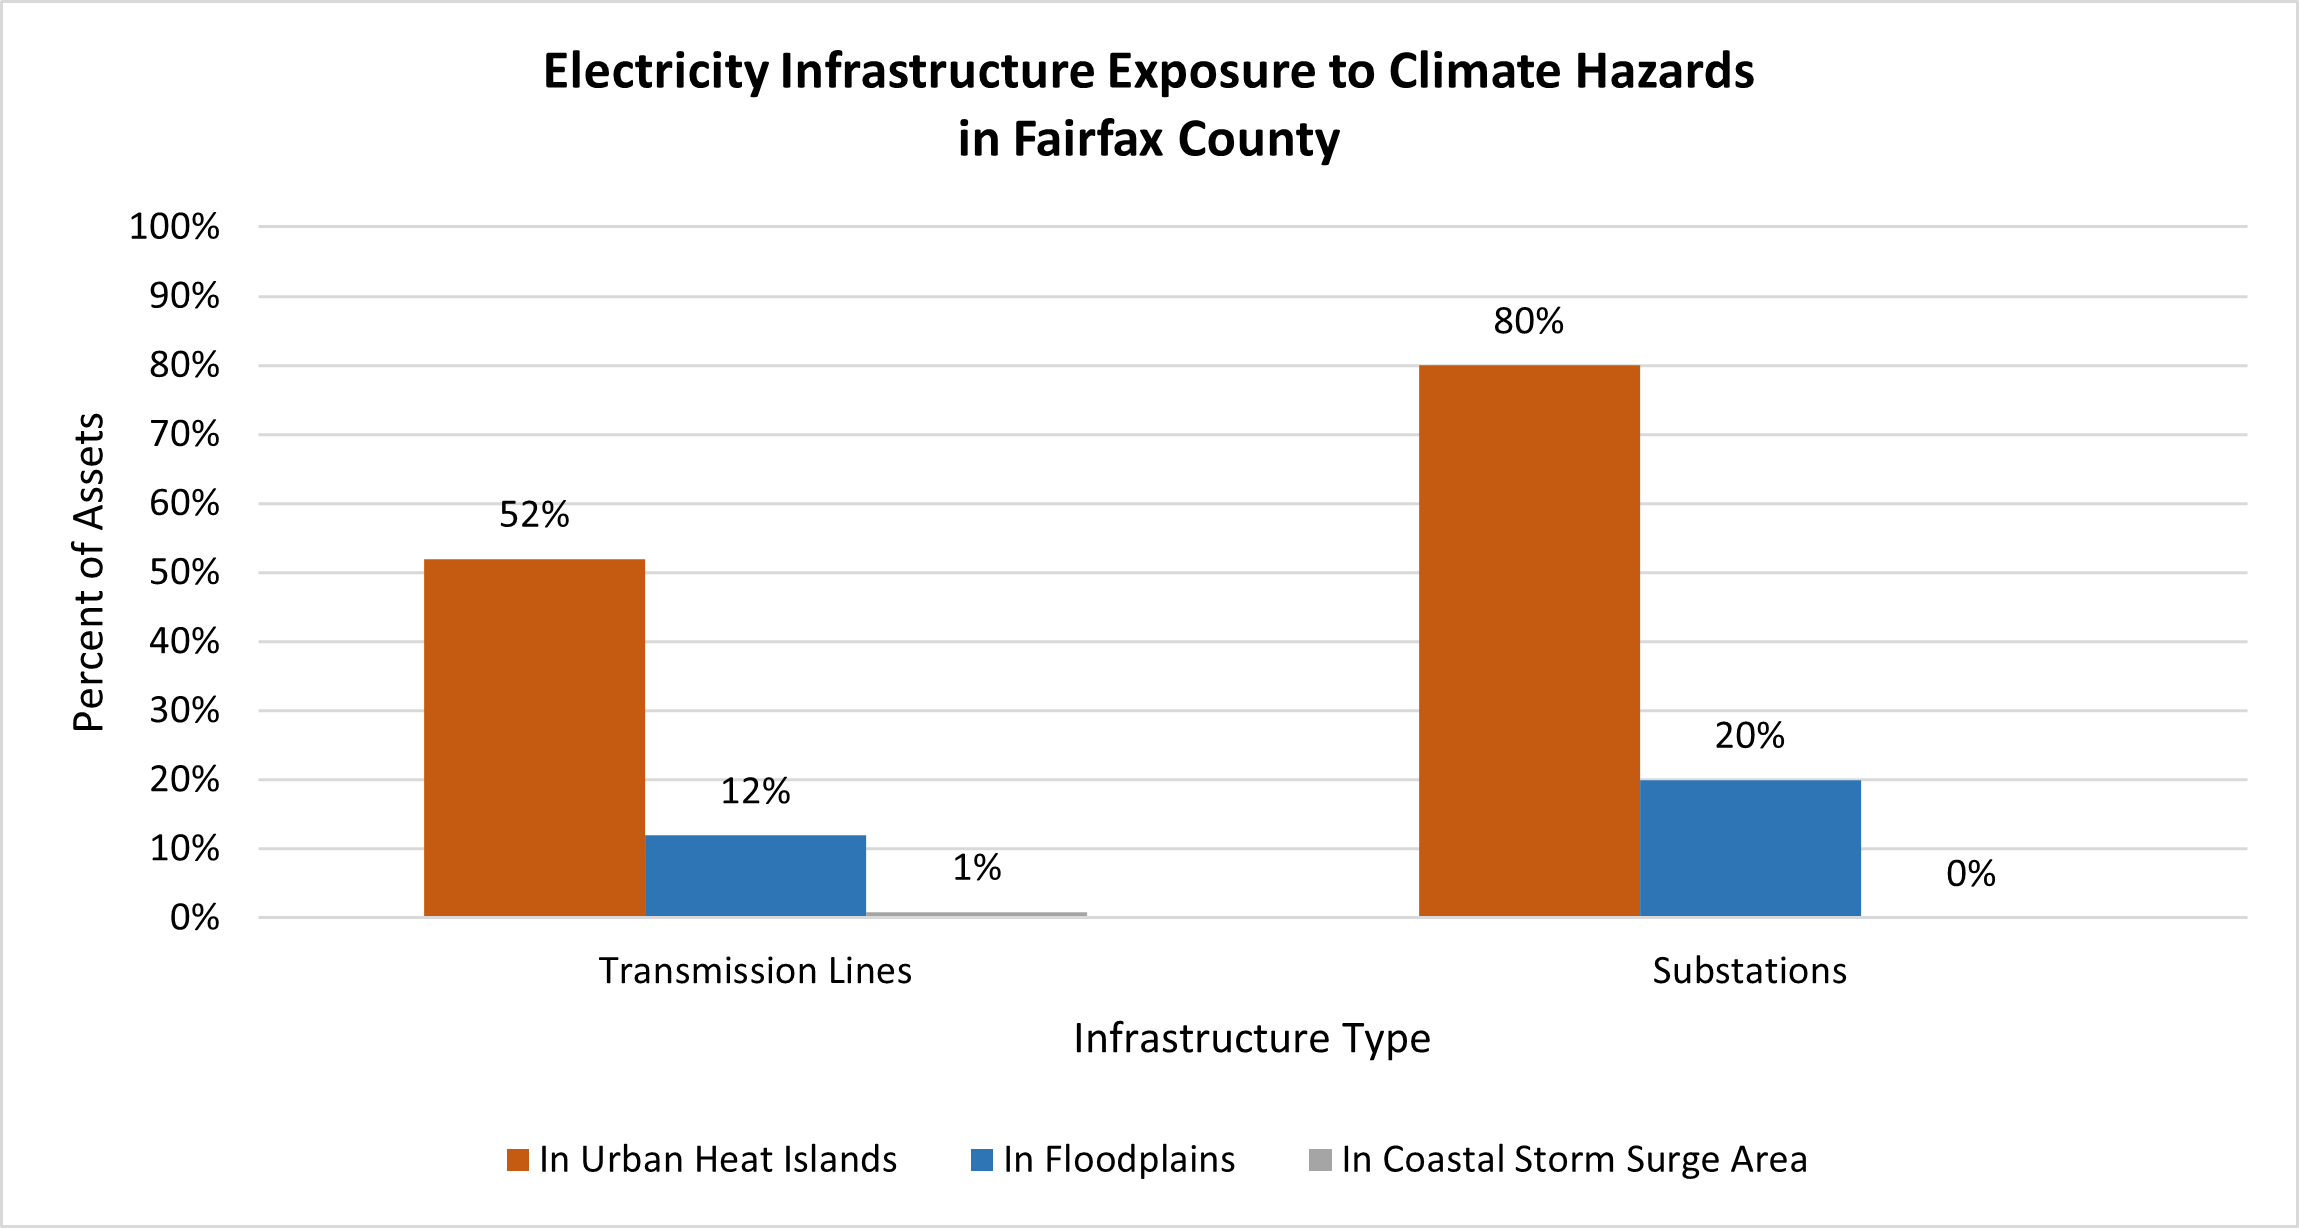
Electricity infrastructure is highly sensitive to extreme heat. Hotter temperatures can cause sagging of overhead lines, reduced efficiency, physical degradation, forced brownouts, and power outages. Extreme heat conditions are projected to increase, resulting in higher exposure for outdoor, above-ground electrical infrastructure. In addition to general extreme heat throughout the county, approximately half (52%) of the major electricity transmission lines in Fairfax County are in areas of high Urban Heat Island effect. This statistic does not include distribution lines that travel to individual homes throughout the county. However, distribution lines that are above ground are also highly exposed to extreme heat. In addition to lines, 80% of substations in Fairfax County are highly exposed to heat conditions.
Electricity infrastructure is also highly sensitive to flooding, which can cause flooded substations, transformers, switch gear, disrupted or downed power lines, and flooding of other supporting electrical infrastructure. Electrical lines that are waterlogged can experience faulting. Flooding of substations and related infrastructure can become hazardous above 3 feet and can lead to blackouts along with reduced reliability. Additionally, excessive underground moisture can produce corrosion of oil tanks, resulting in leakages that cause fires and other threats to safety. Approximately 12% of Fairfax County’s major transmission lines and 20% of electric utility owned properties (i.e. substations) are located in FEMA or county floodplains.
Additionally, electricity infrastructure is highly exposed and highly sensitive to severe storms and wind. Transmission and distributions systems are particularly sensitive to damage from high winds, which cause power outages and fire risks. Increased exposure to lightning presents a unique vulnerability to overhead lines and transmission and distribution poles. For more detailed information on these vulnerabilities, please see the Vulnerability and Risk Assessment.
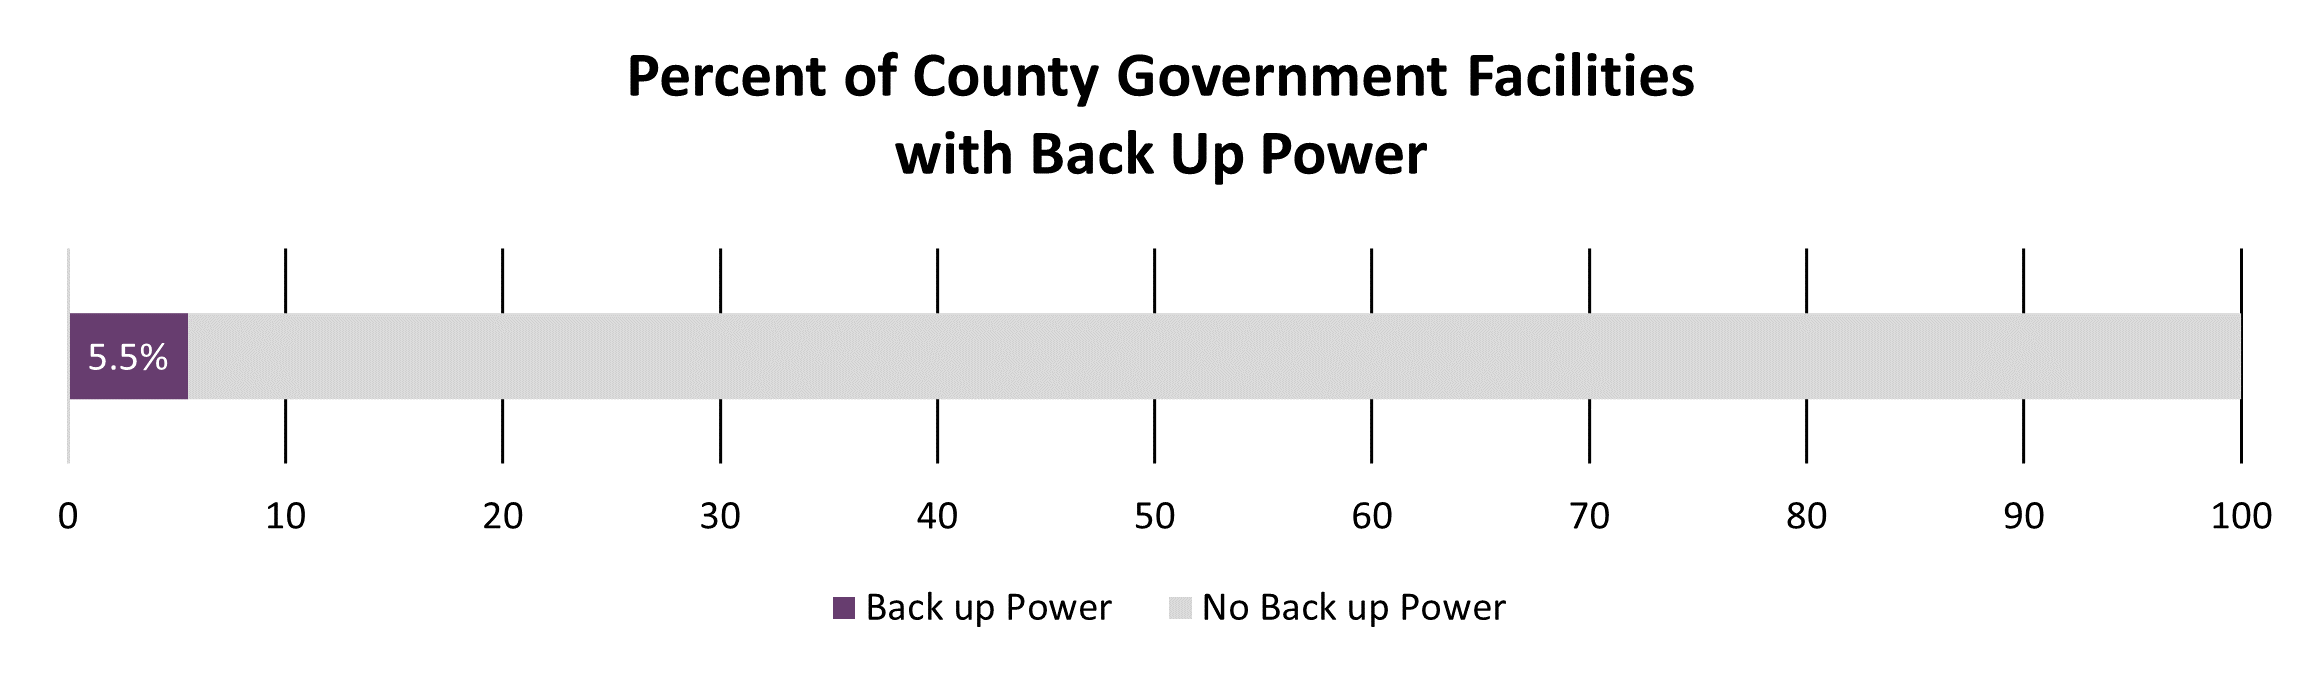
Electricity infrastructure is owned and managed by utility companies, rather than the county government. However, the county government has a role to play in ensuring that county government facilities can continue operating to provide critical public services. One goal in Resilient Fairfax is to increase the percentage of county government facilities that have back up power. As of 2023, approximately 5.5% of facilities, or 17 facilities on the Continuity of Operations list, have back-up generators available for power outages.
Natural Gas Infrastructure Vulnerabilities
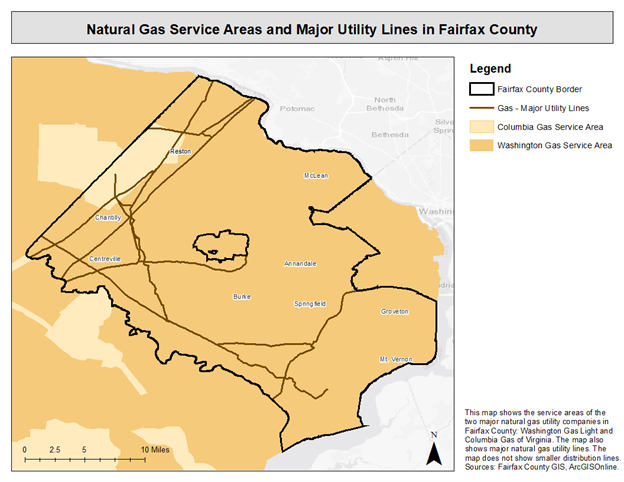
Most residents in Fairfax County are served by Washington Gas, but portions of Chantilly and Herndon are served by Columbia Gas. Additionally, several natural gas pipelines cross through the county, including those associated with Colonial, Columbia Gas, Cove Point, Dominion, and Transcontinental. Natural gas infrastructure is managed by these private entities and is not controlled by Fairfax County government. The figure below shows the major natural gas supply lines in Fairfax County. The GIS data does not include distribution or lateral connections to homes, which are numerous throughout the county.
Natural gas infrastructure is not as vulnerable to climatic hazards as electricity infrastructure, but it has moderate vulnerability to inland flooding, severe storms, and extreme cold.
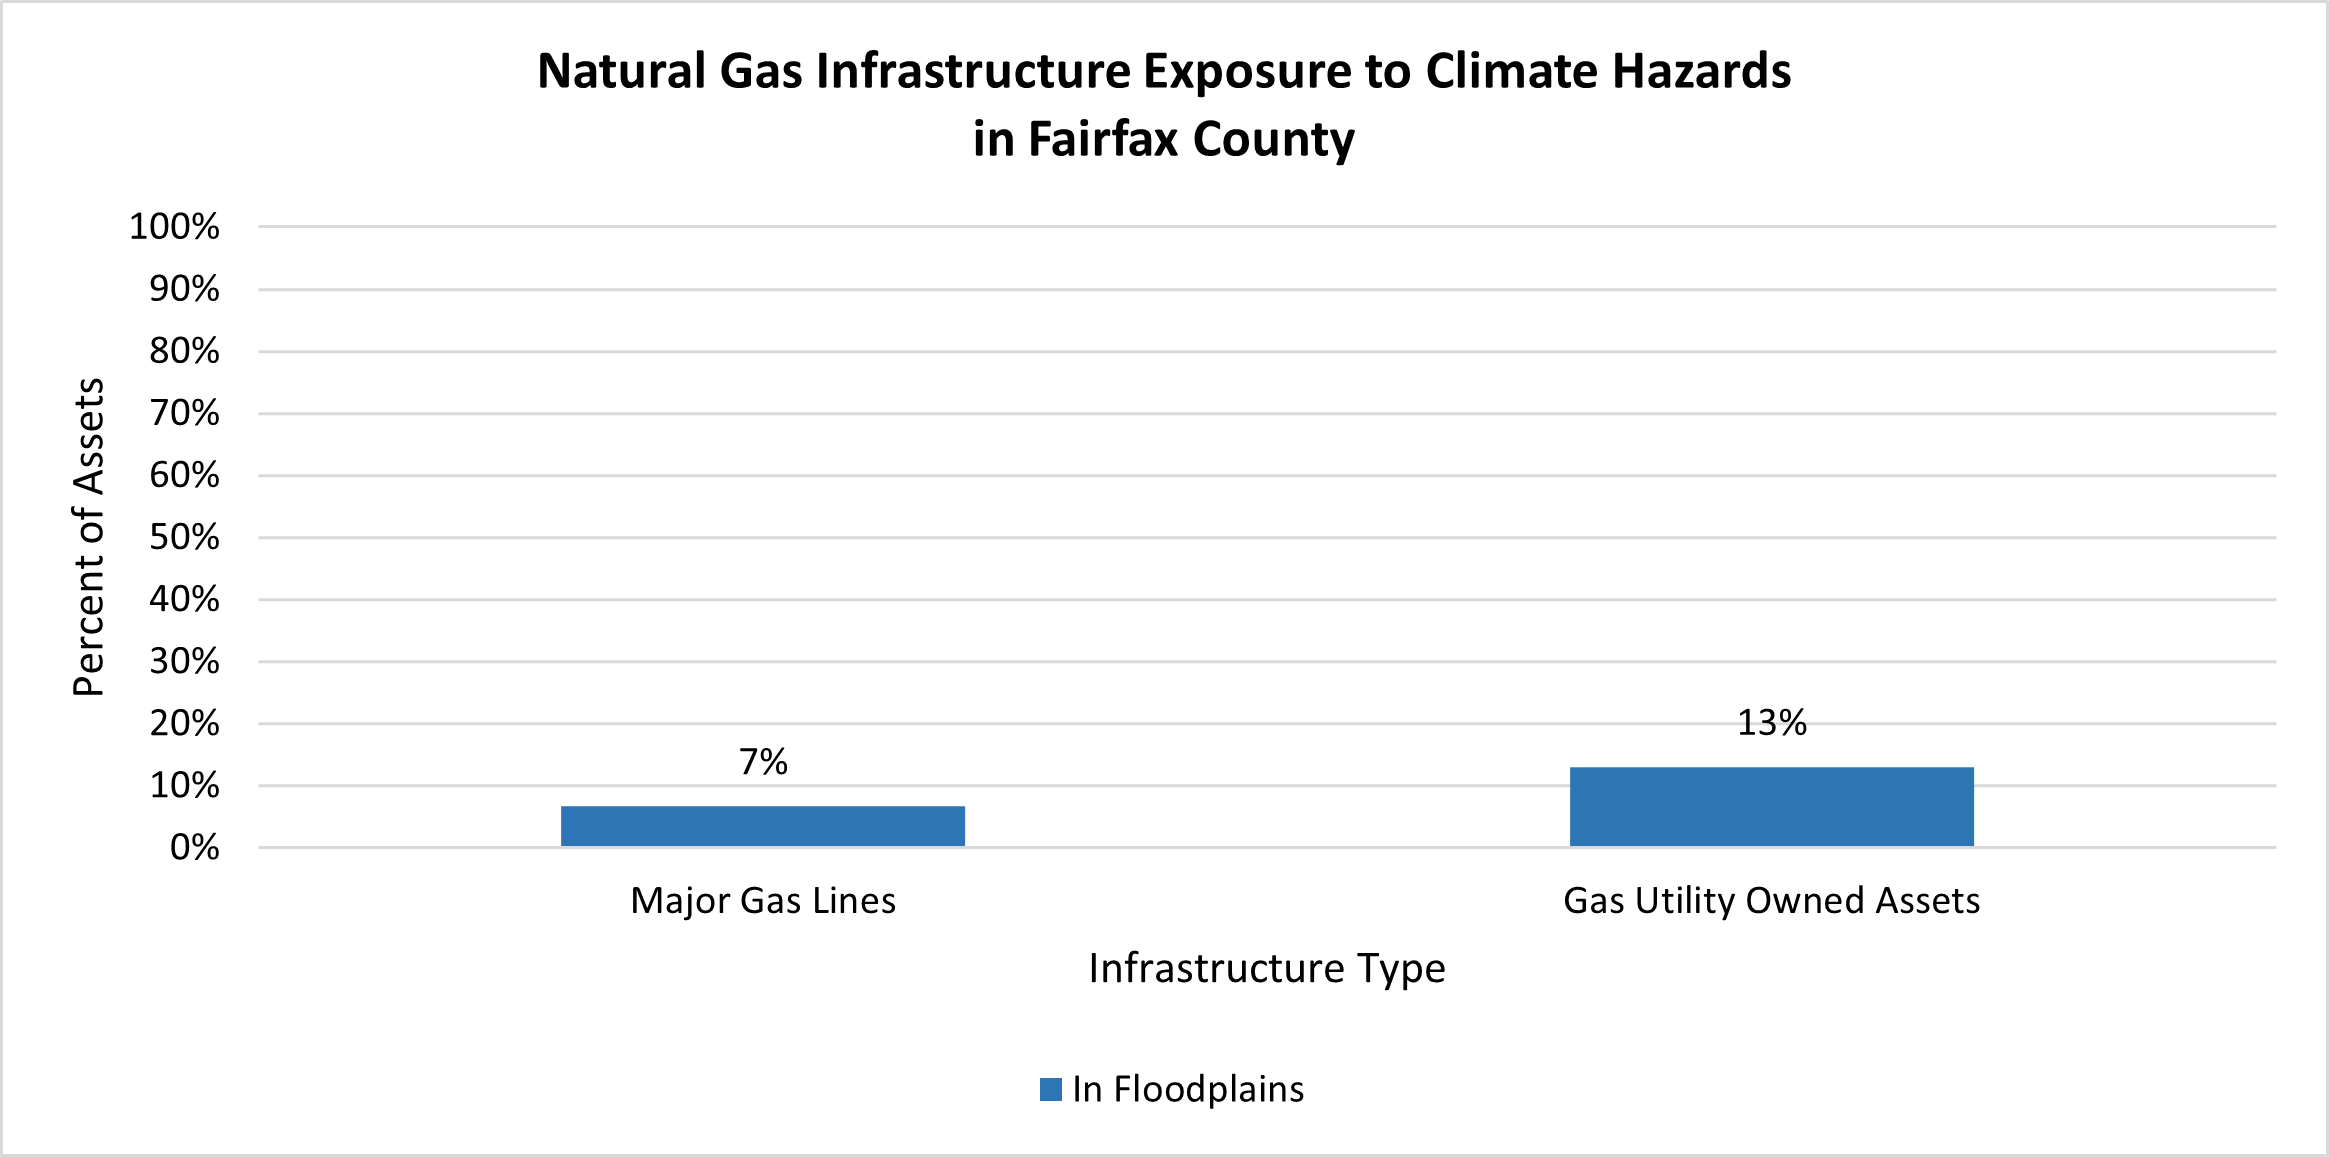
In terms of flooding, approximately 4-7% of major natural gas utility lines and 14% of natural gas parcels (i.e. above-ground processing stations) intersect FEMA or county floodplains. When exposed to flooding, natural gas infrastructure is moderately sensitive, which means the hazard could cause temporary operational issues with some components, but usually not larger shutdowns. Water can infiltrate pipes in low pressure areas, and gas lines that are waterlogged can experience faulting. There are alerts and water capture devices in place to mitigate the risk.
In terms of severe storms and wind, natural gas infrastructure has a moderate sensitivity, because there is potential for damage to above-ground components of compressor stations, city gates, storage facilities, and pressure regulating stations. Additionally, loss of power from severe storms can limit utilities’ ability to receive alerts from pressure monitoring stations.
In terms of extreme cold, natural gas infrastructure is vulnerable when temperatures are 5*F or below. Extreme cold events may lead to freezing in natural gas infrastructure at any point in the system. Low pressure areas are especially likely to freeze. Freezing can also cause shutdowns in controllers or regulators, when demand for natural gas increases during cold weather as people need to heat their homes. However, extreme cold is decreasing on average in Fairfax County, reducing this vulnerability. For more detailed information on these vulnerabilities, please see the Vulnerability and Risk Assessment.
Telecommunications Infrastructure Vulnerabilities
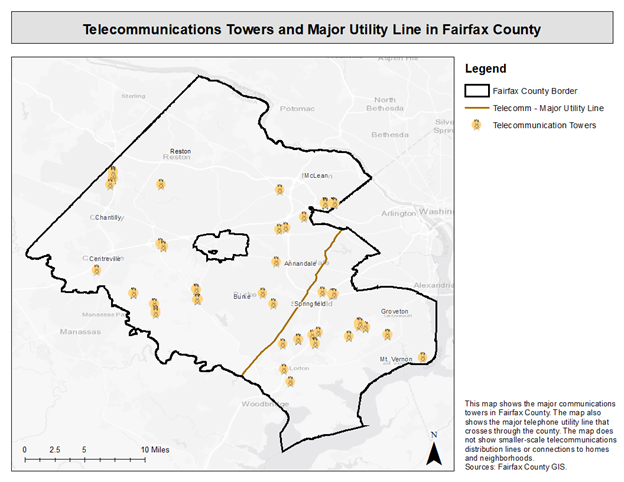
Telecommunications infrastructure includes telephone, cable, internet, or broadcast communication. Most telecommunications infrastructure is privately owned. However, the county government holds authority over public safety communications for fire, police, and other emergency response activities. The impacts of climate change can cause vulnerabilities in communications infrastructure. Telecommunications infrastructure has a moderate vulnerability to extreme heat and inland flooding, and a moderately high vulnerability to severe storms. The map below shows the major telecommunication towers and the major telephone utility line in Fairfax County. The map does not show the distribution lines to individual homes, which are prolific throughout the county.
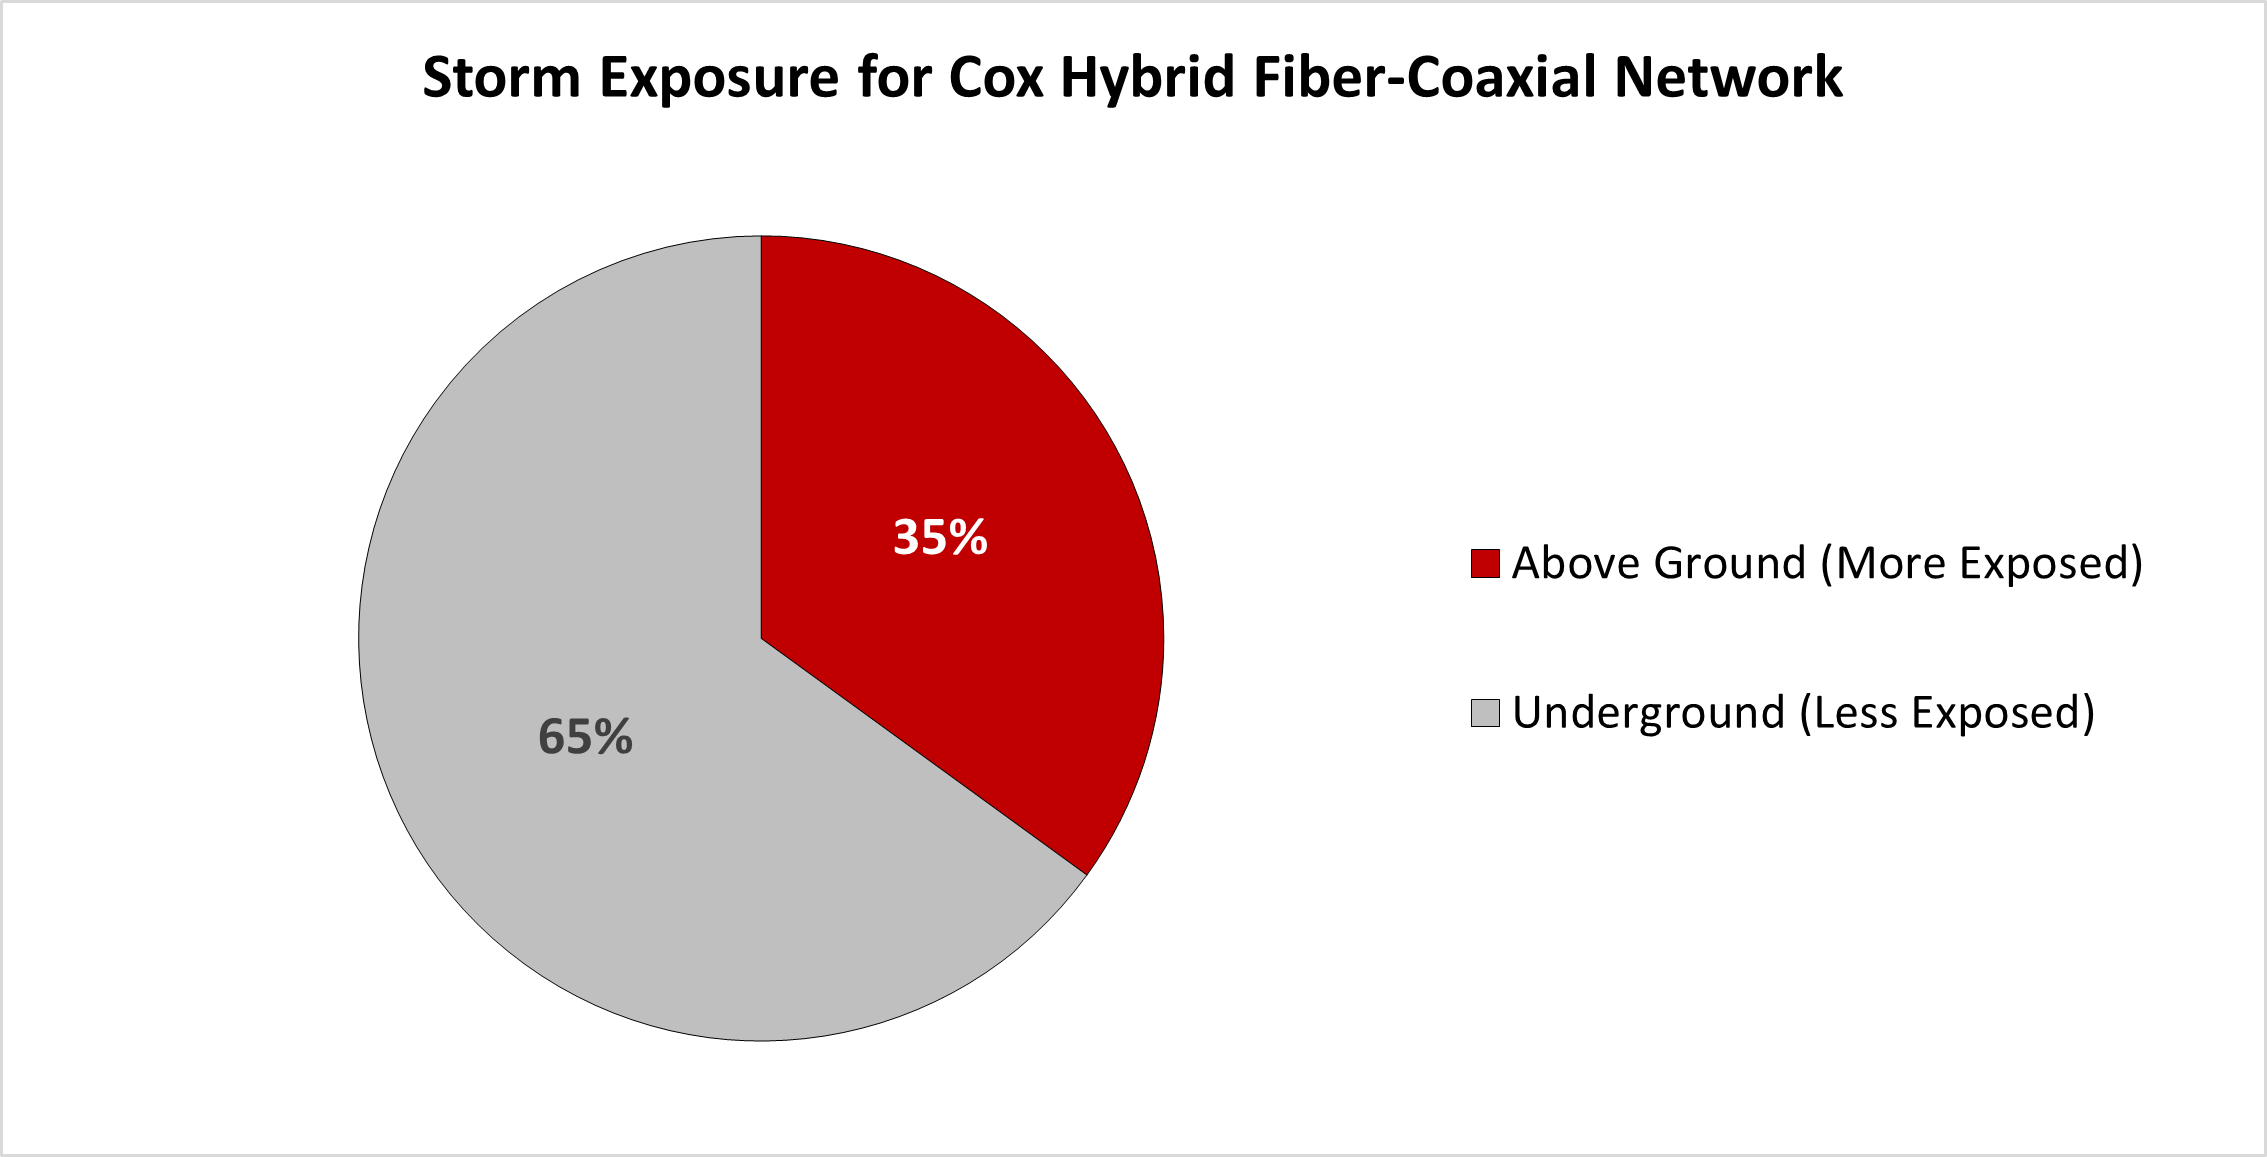
The top climate-related vulnerability for telecommunications infrastructure is severe storms. Severe storms are increasing in frequency and severity. Above-ground assets have higher direct exposure to severe storms than underground assets. Cox Communications reports that 35% (2,204 miles) of their hybrid fiber-coaxial network infrastructure is above ground and 65% (4,094 miles) is underground in Fairfax County. Equivalent statistics for Verizon and Comcast are unknown. Falling trees and extreme winds can damage telecommunications infrastructure, preventing transmission, disrupting service, and delaying emergency communications. Extreme heat poses a moderate vulnerability, placing a strain on telecommunications infrastructure, sagging communication lines, and causing loss of power supply during “black outs” or “brown outs.”
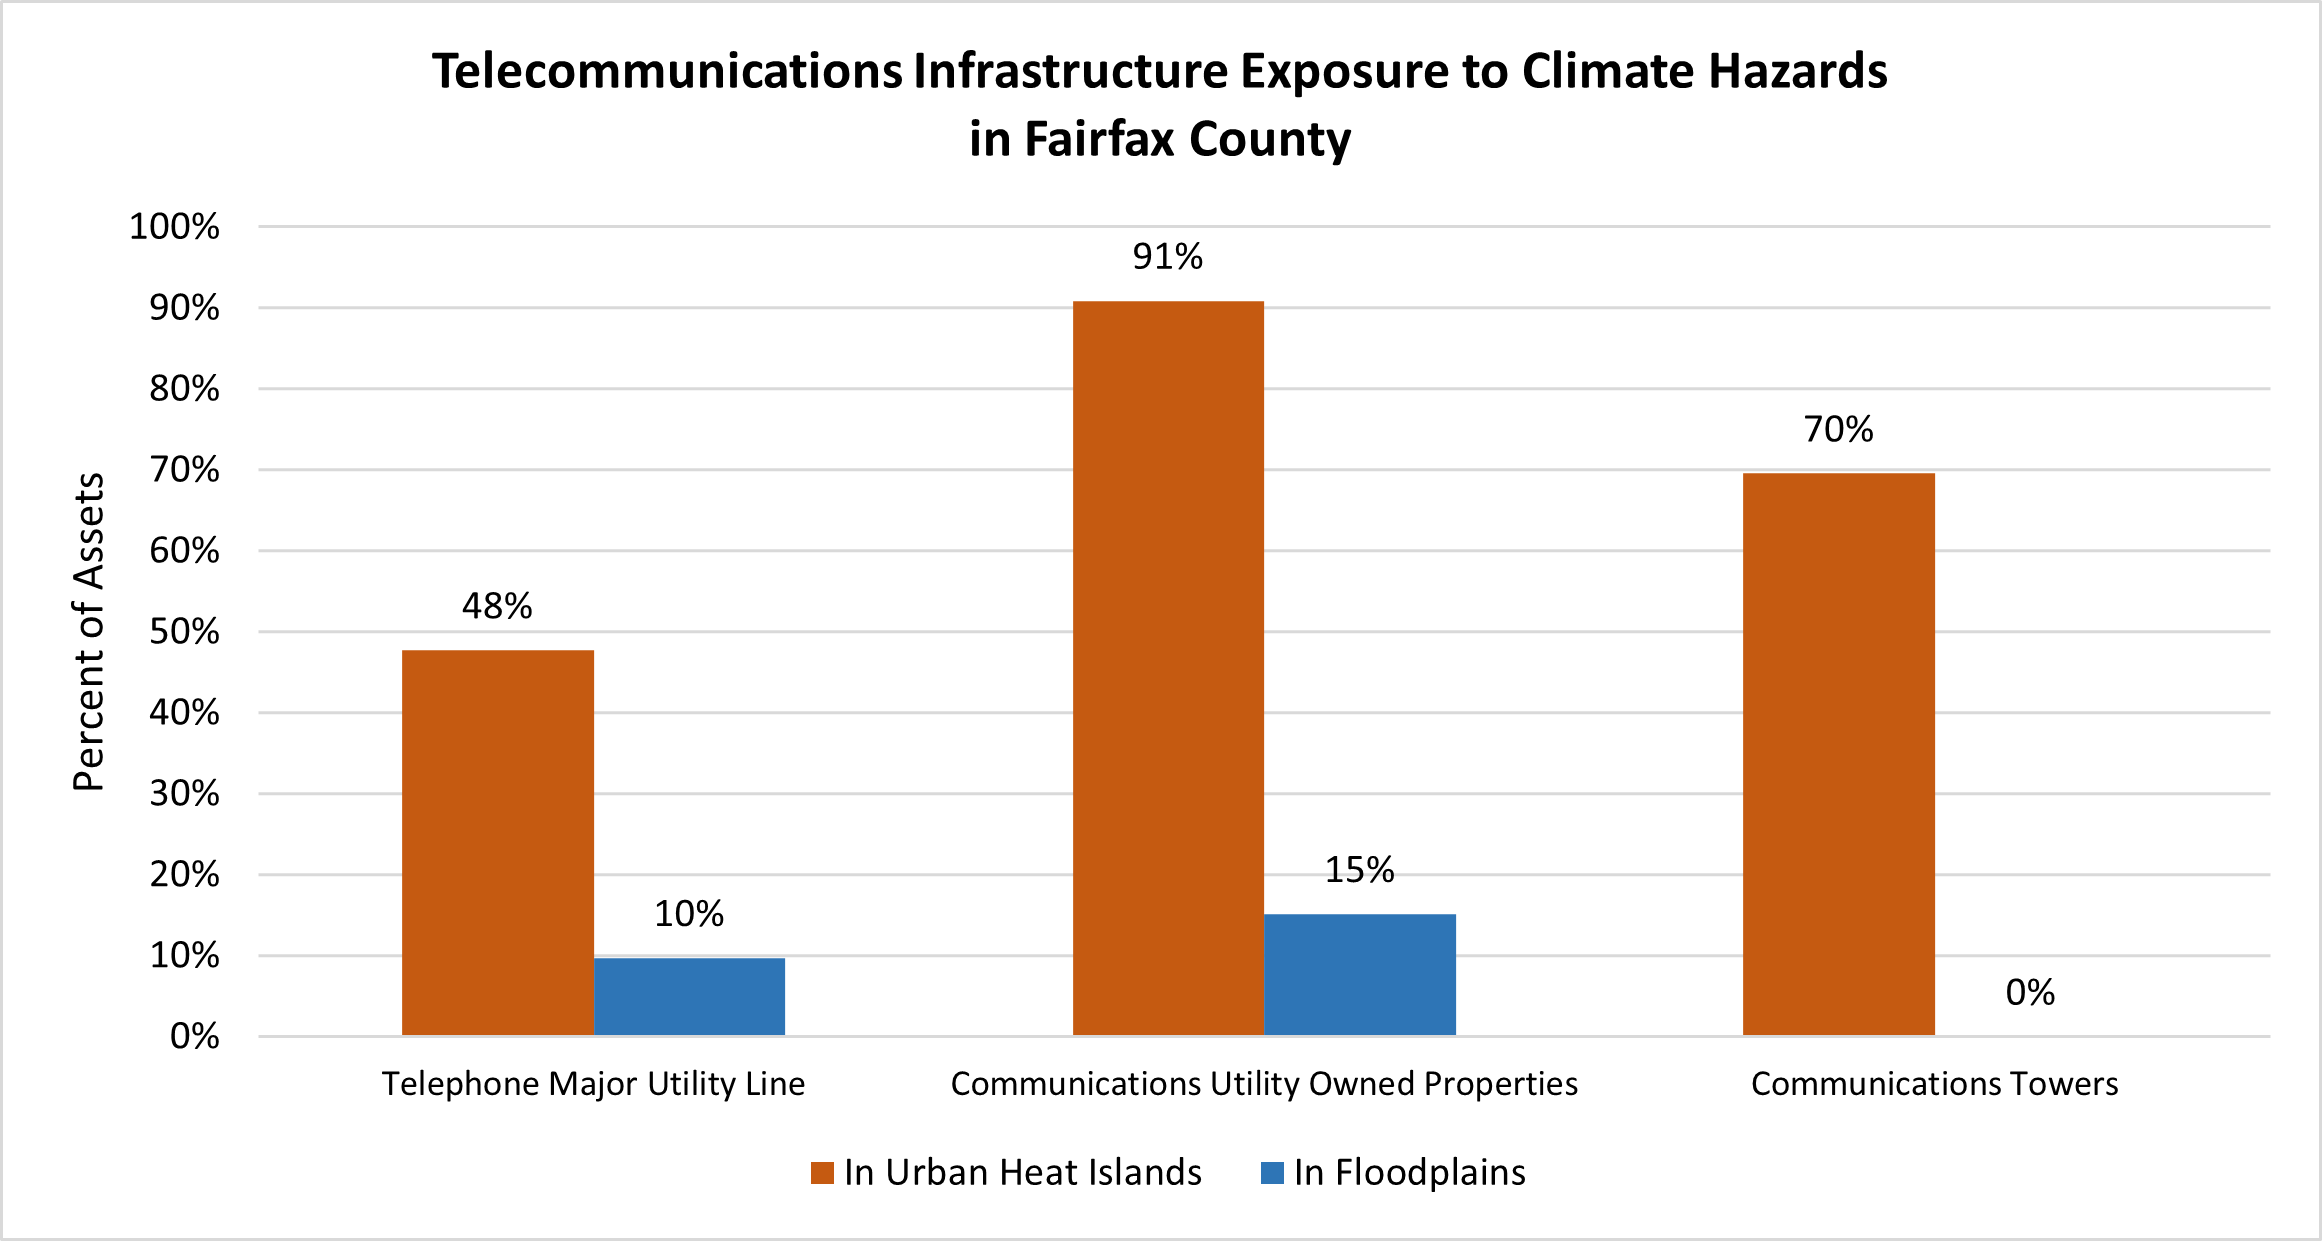
Approximately 90% of communications utility owned properties and 70% of communications towers in Fairfax County are in Urban Heat Islands, which have higher exposure to extreme heat. Flooding can also cause moderate vulnerability for telecommunications infrastructure, impacting transmission of radio signals and wireless connection, compromising pole stability, and inundating underground vaults. In Fairfax County, 10% of the major telephone utility line and 15% of communications-utility owned properties intersect with FEMA or county floodplains. There are no known telecommunications towers in floodplains. There is no known exposure of telecommunications infrastructure in Fairfax County to coastal flooding of the Potomac River.
This section of the dashboard highlighted a few key metrics relevant to energy and/or telecommunications infrastructure and climate resilience. For climate data and projections in general, please see the Overall Resilience Metrics page. For an interactive map of climate hazards and assets, please see the Resilient Fairfax Interactive Map Viewer. For more information on vulnerabilities, please see the Resilient Fairfax Climate Vulnerability and Risk Assessment (VRA). For more information on Resilient Fairfax and what Fairfax County is doing to address these issues, please see the Resilient Fairfax website.


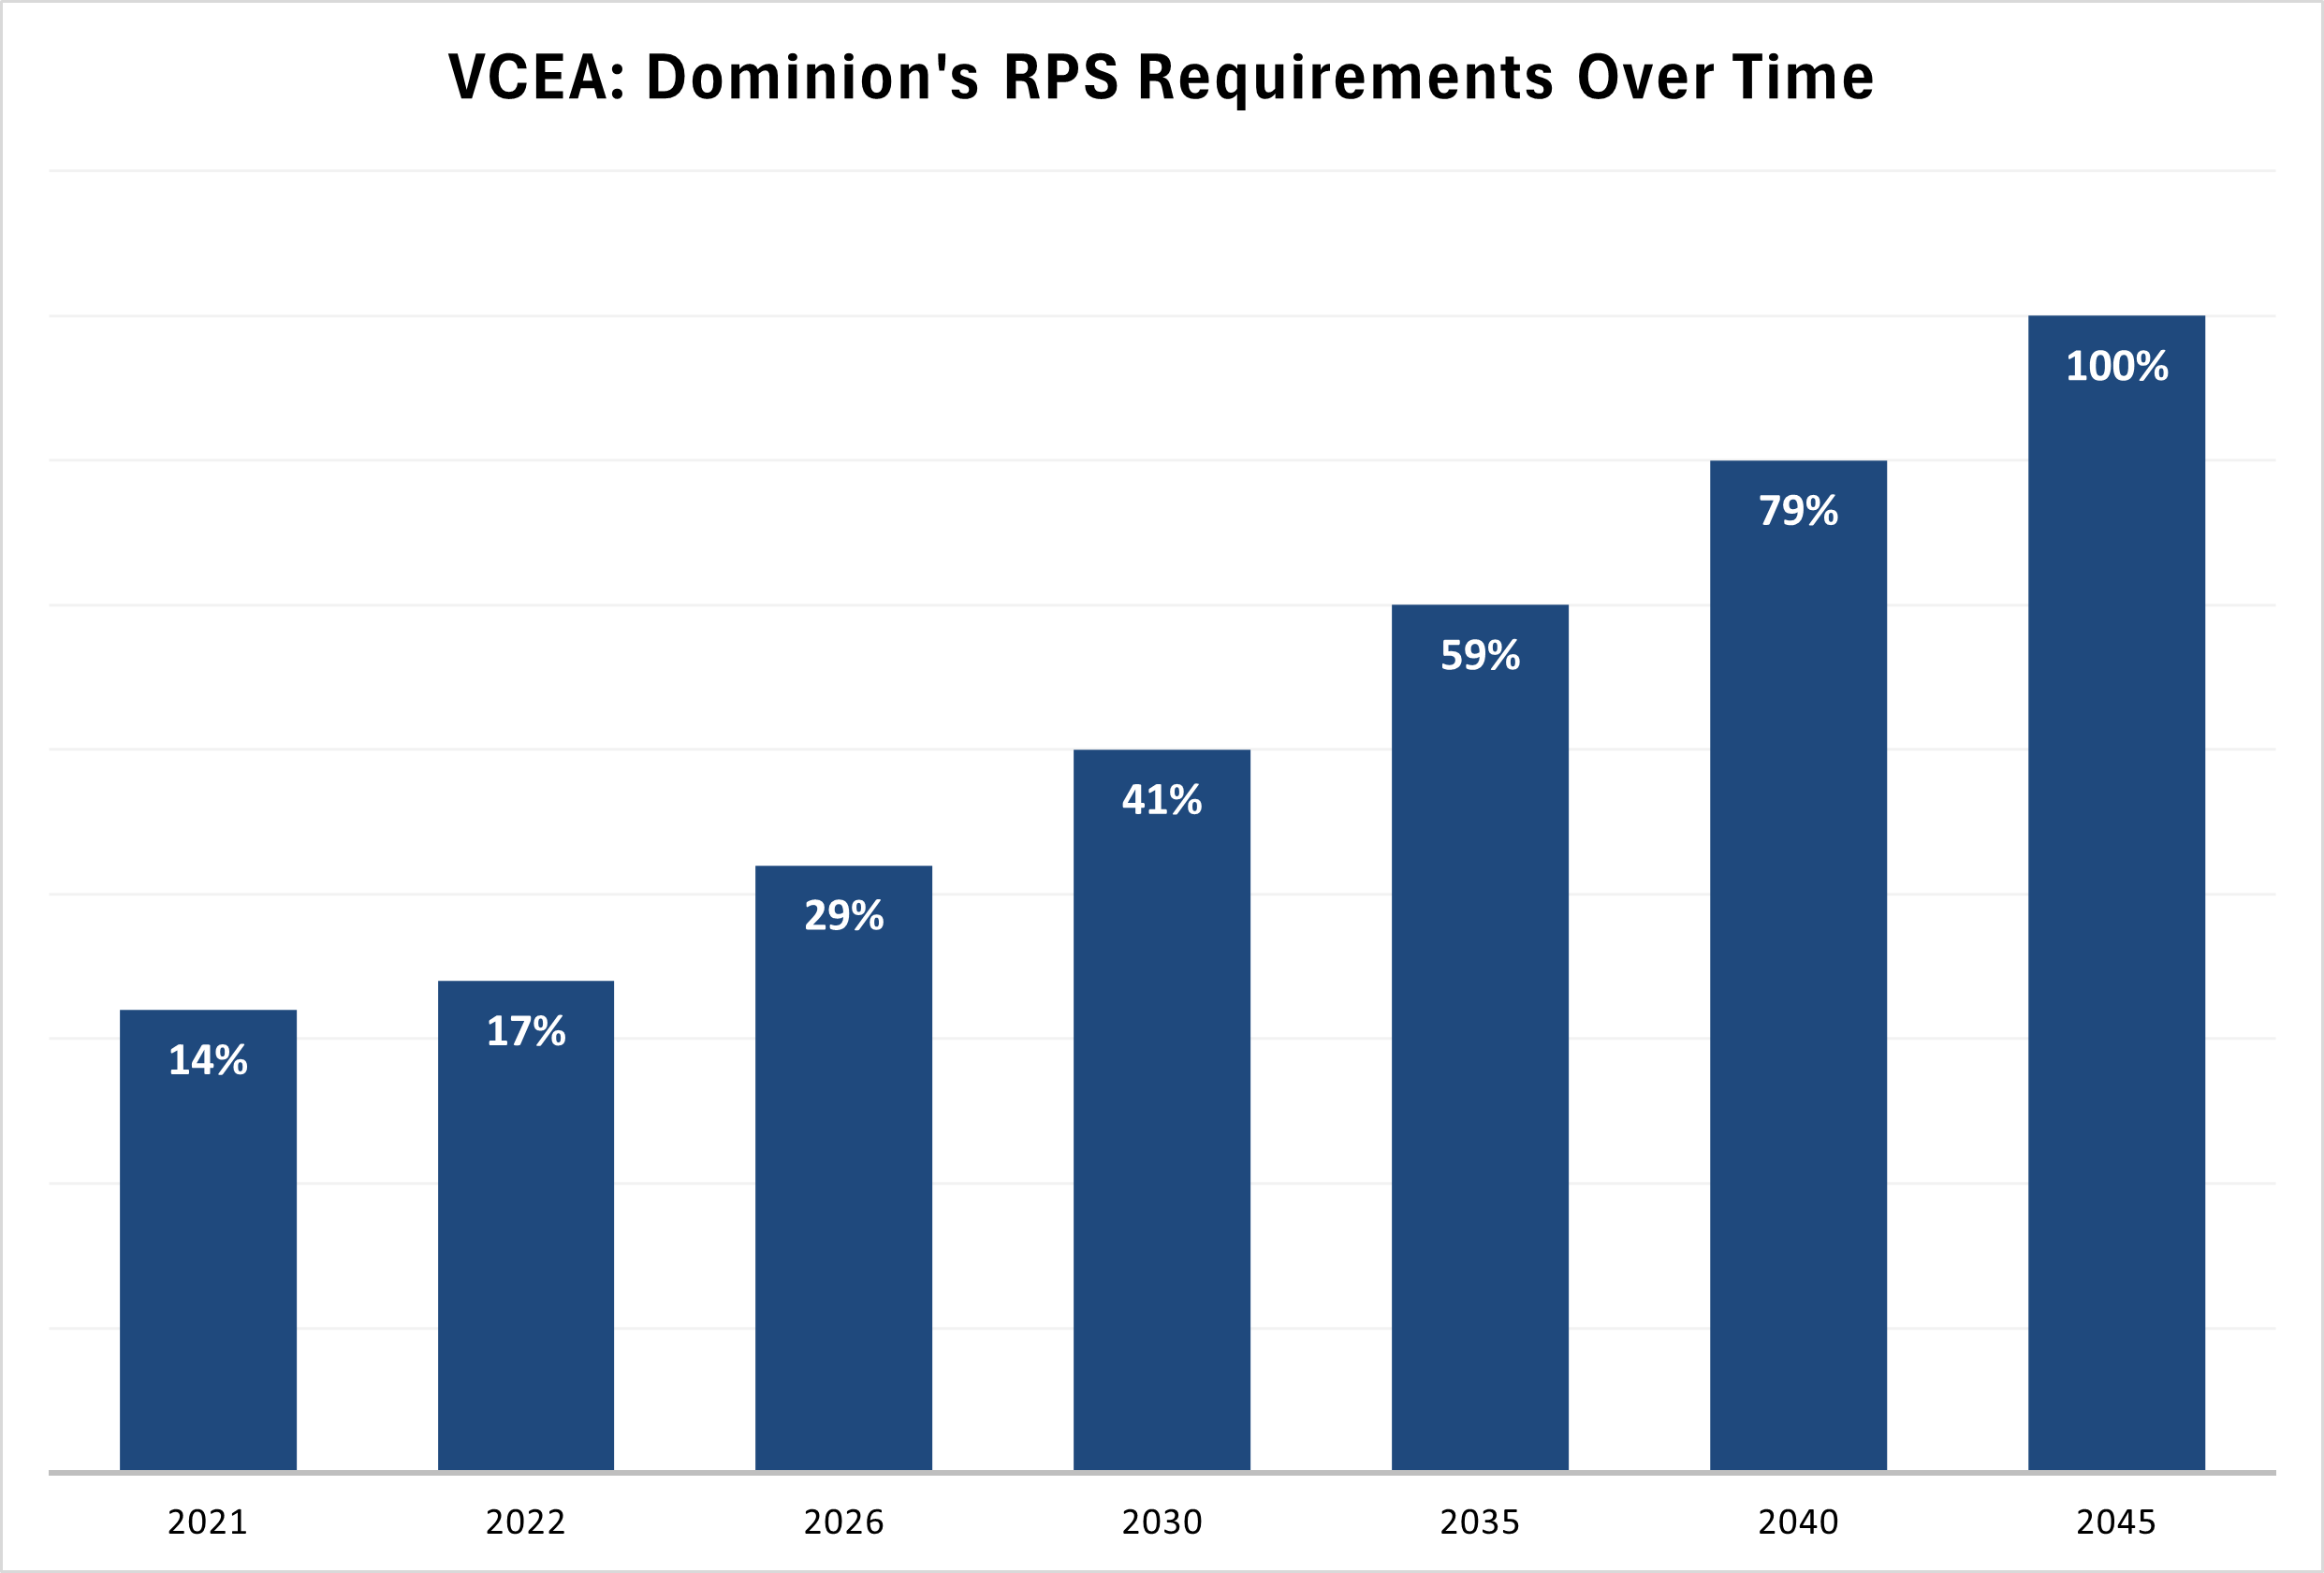
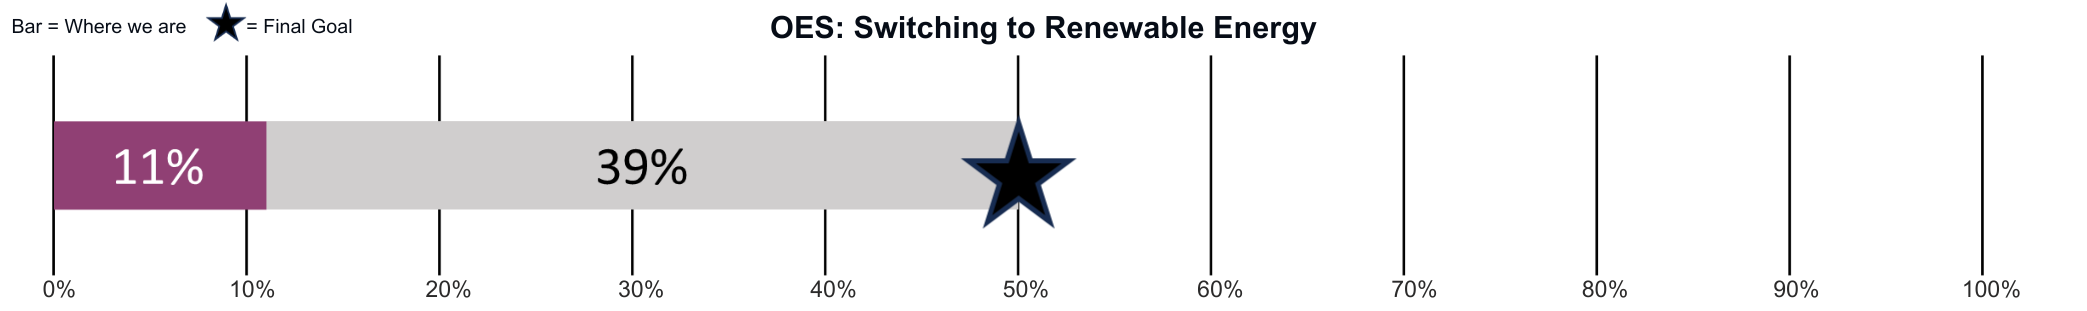
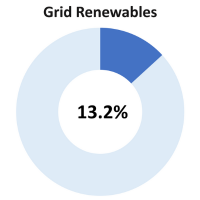 CECAP scenario modeling assumes Dominion Energy (the primary electric provider in Fairfax County) will meet the required percentages of renewable energy in the renewable portfolio standard (RPS), defined by the 2020 Virginia Clean Economy Act (VCEA). The RPS requirements define the percentage of non-nuclear electricity sold to Dominion Energy’s customers which comes from renewable sources. The required percentage increases every year, culminating at 100% in 2045. This strategy accounts for 13.2% of the emissions reduction needed to meet the 2050 CECAP goal.
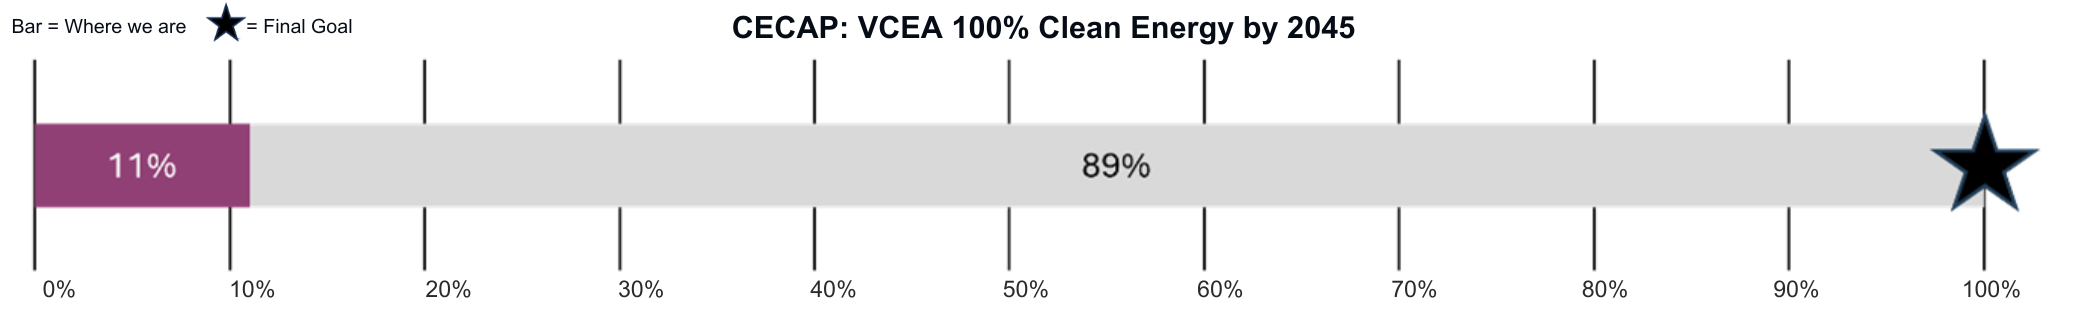
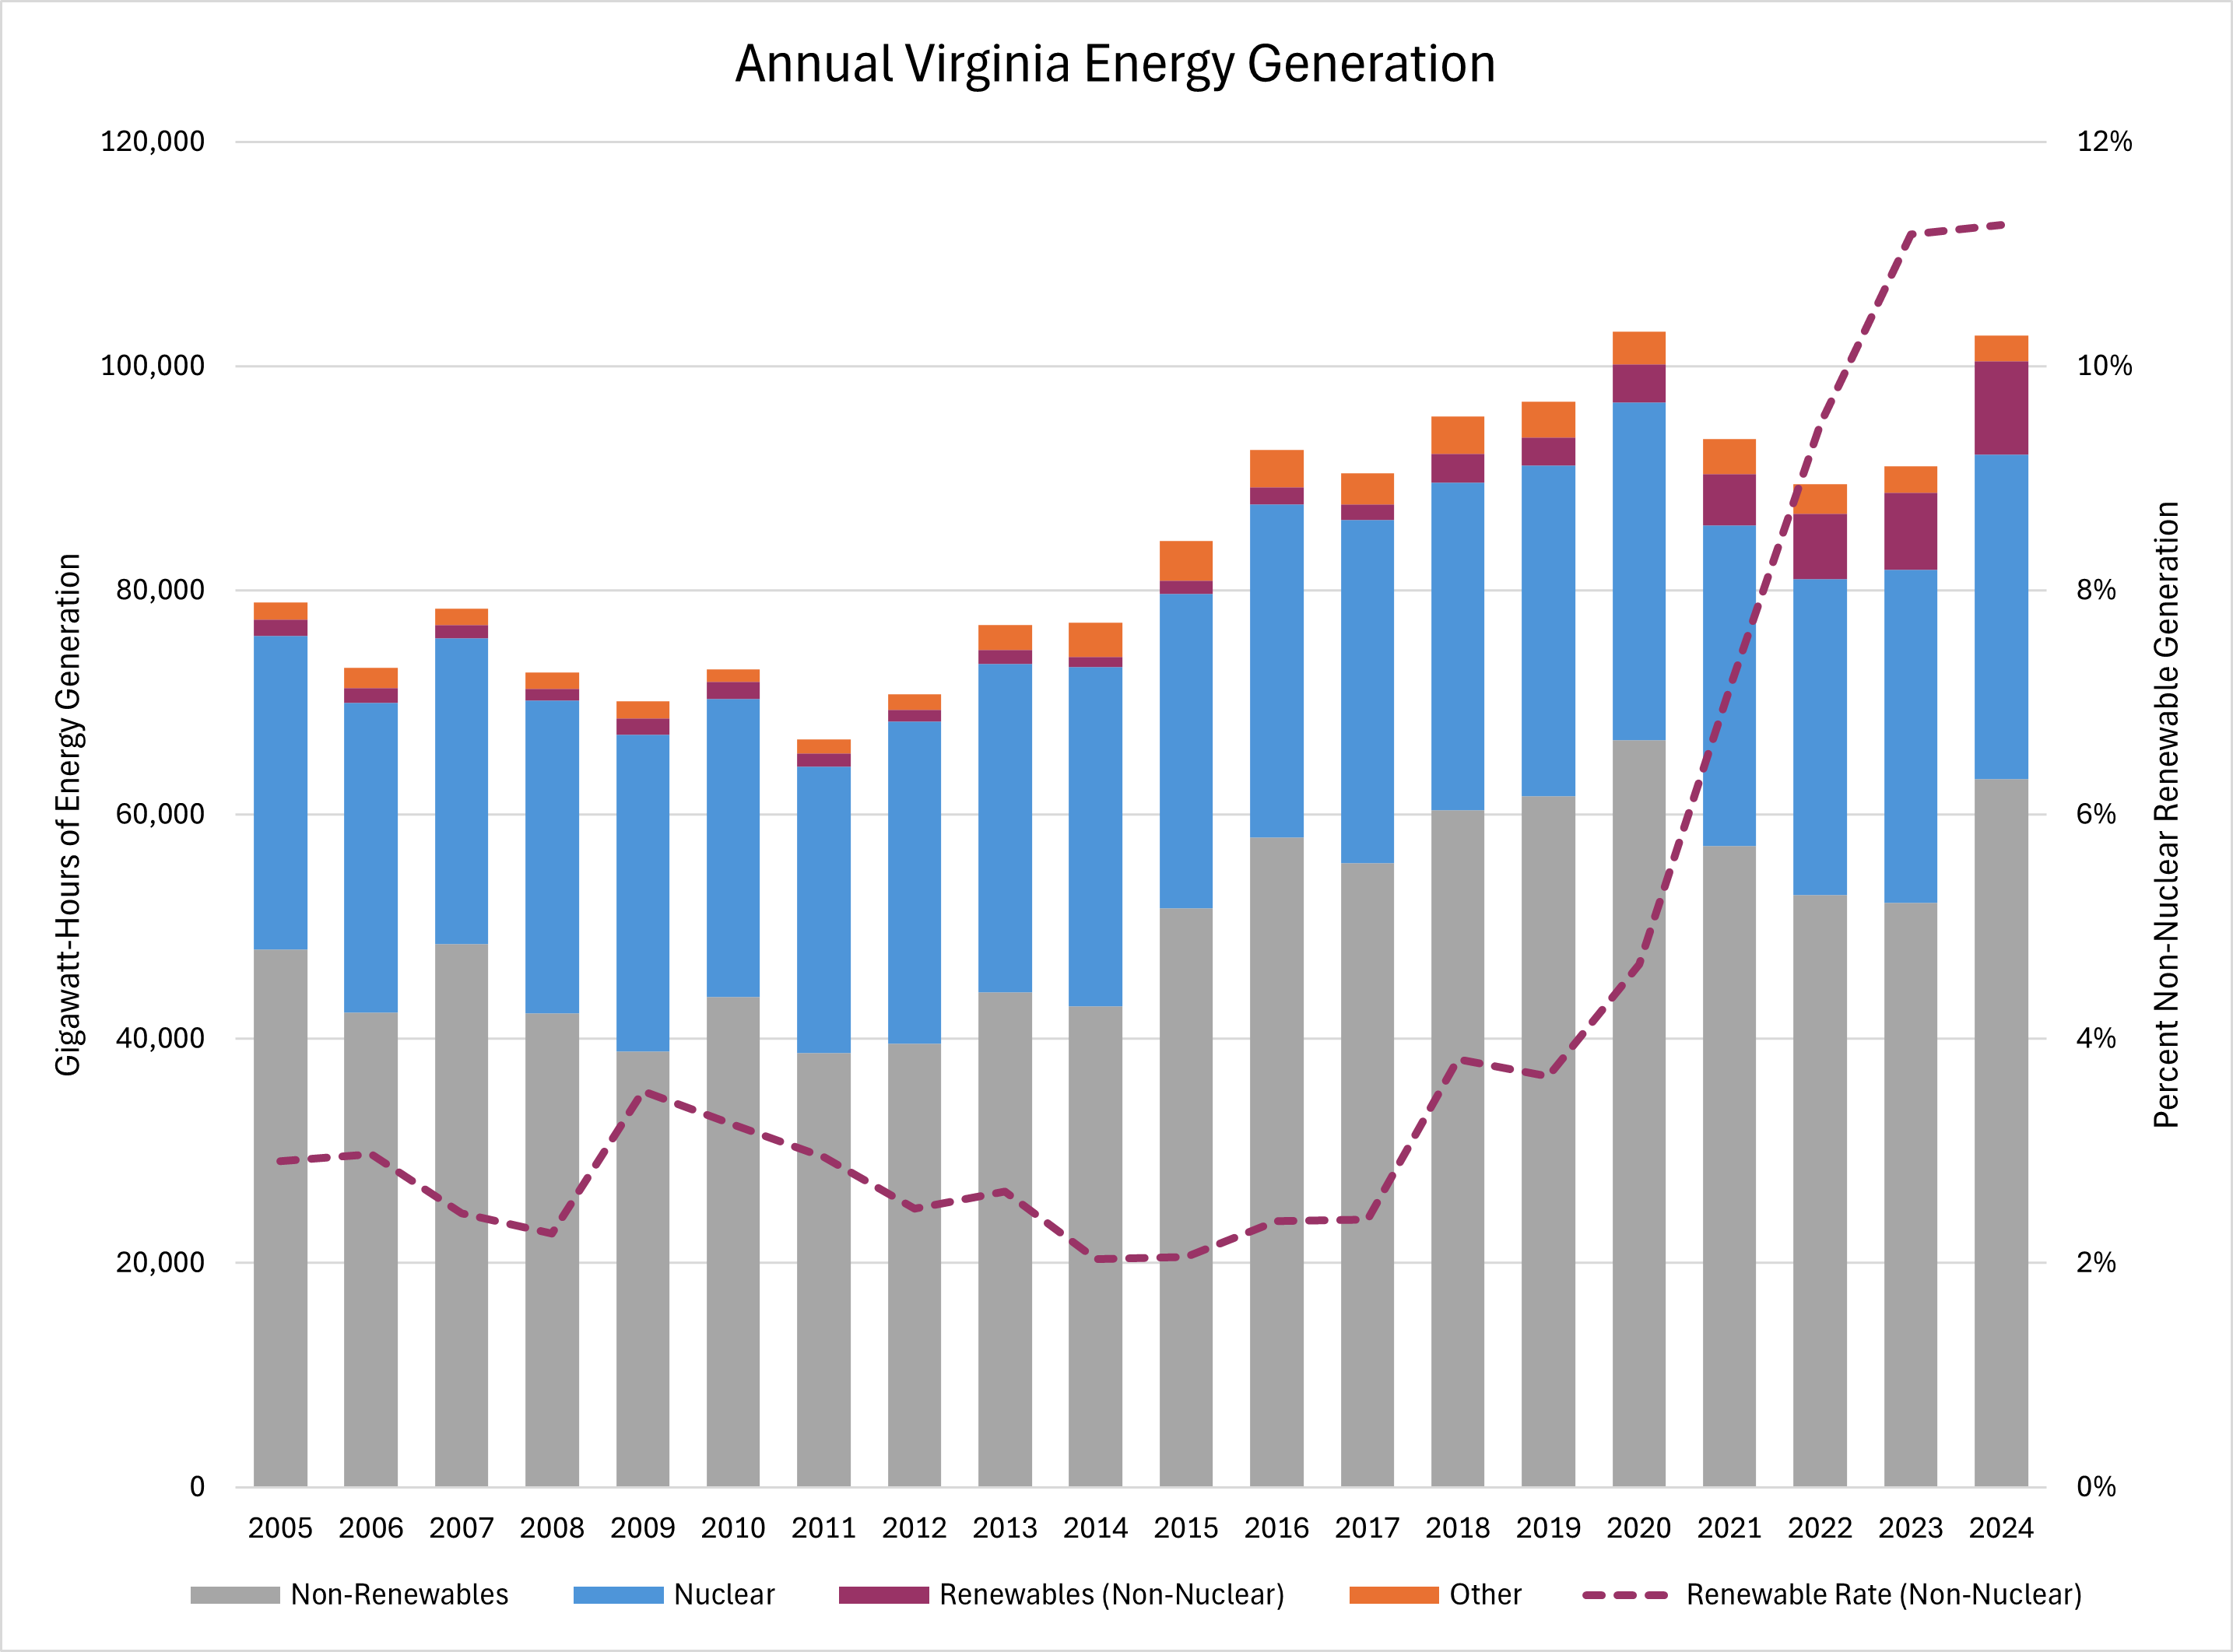
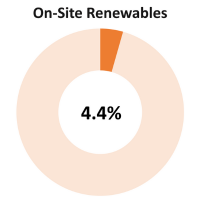 CECAP sets goals to increase onsite solar photovoltaic (PV) capacity in Fairfax County to 46 MW by 2030 and 112 MW by 2050. This strategy accounts for 4.4% of the emissions reduction needed to meet the 2050 CECAP goal.
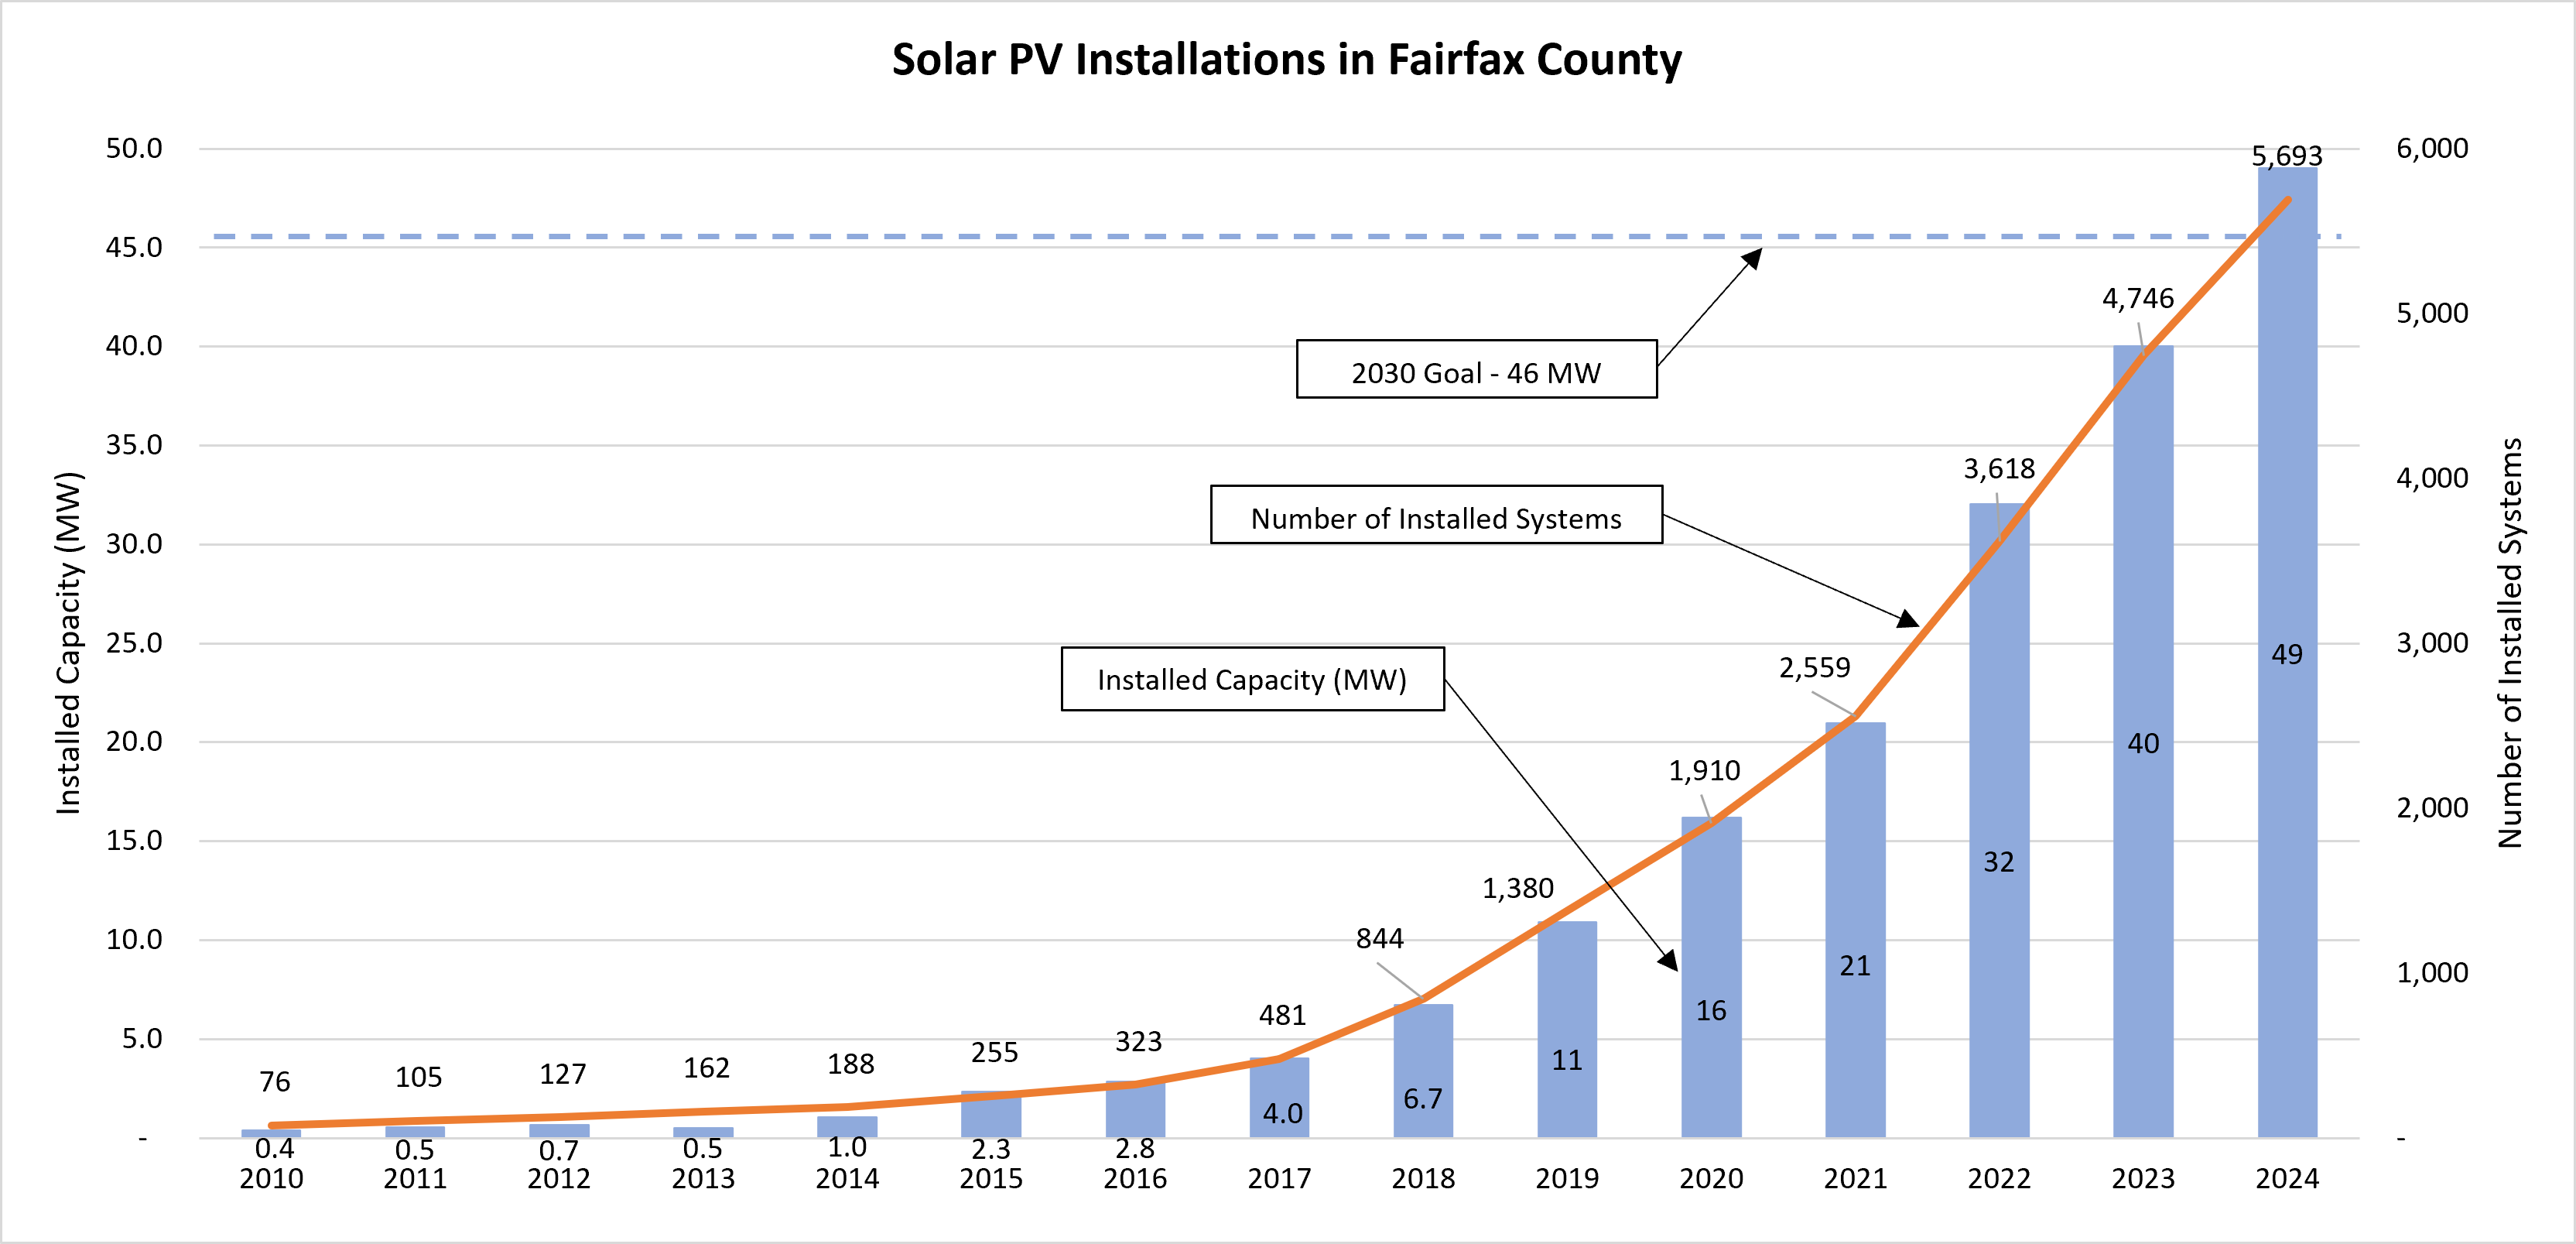
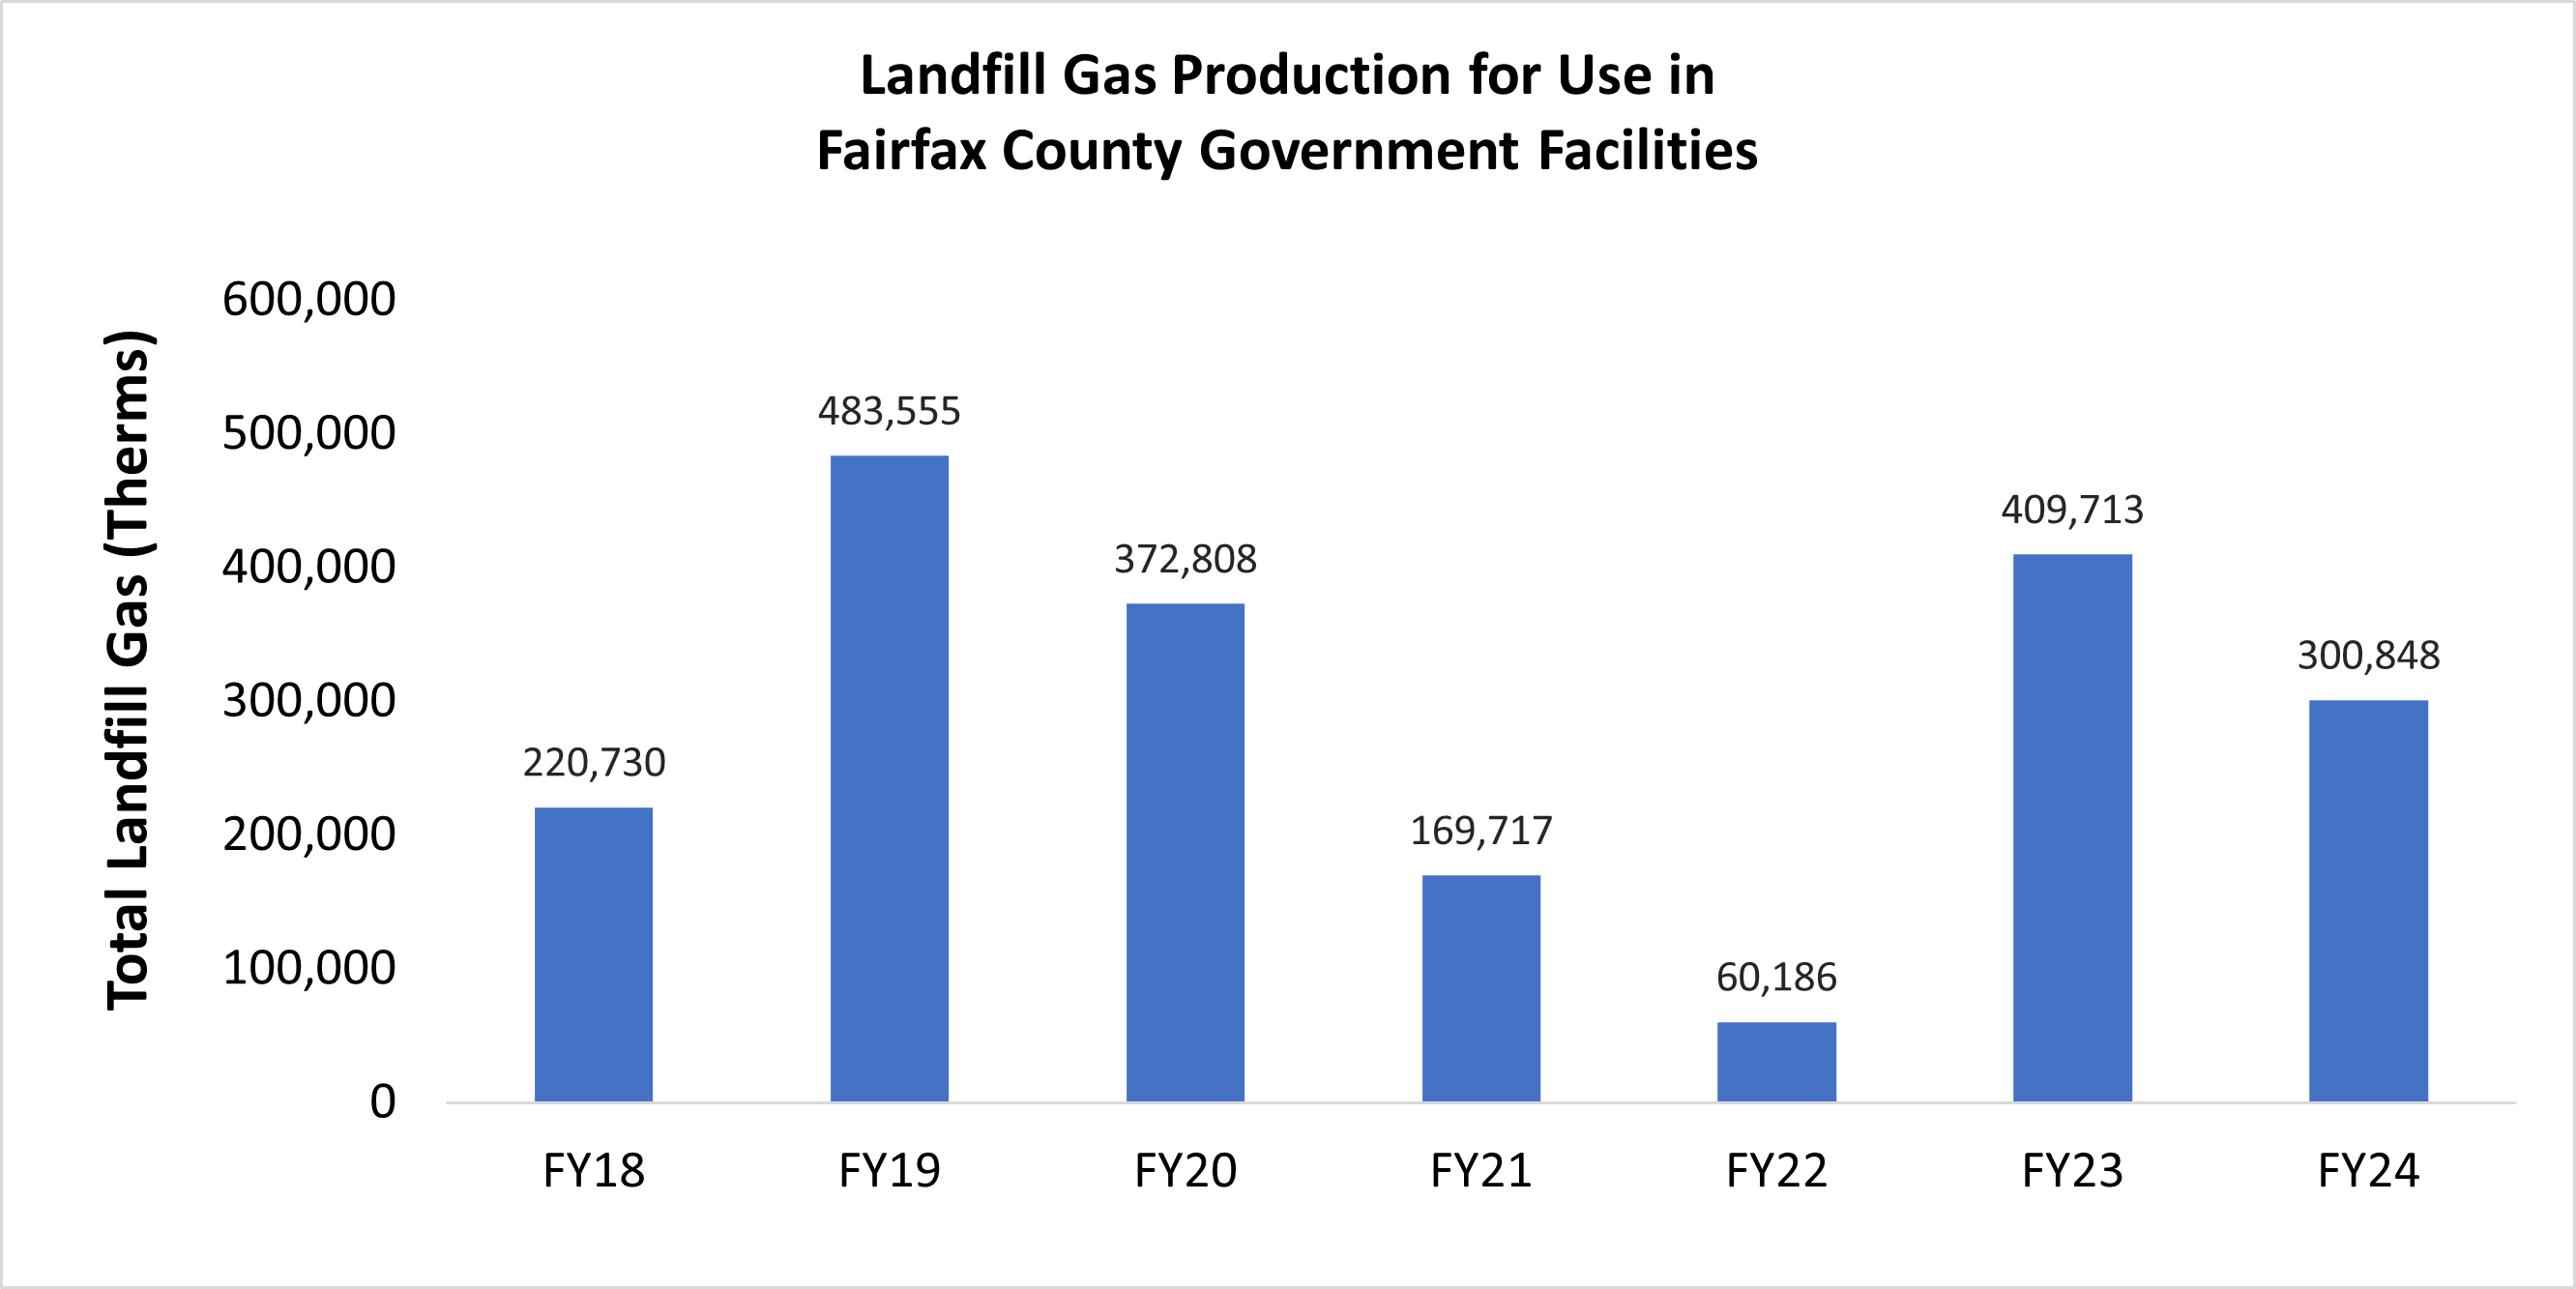
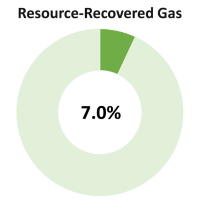 CECAP sets goals to increase “resource recovered gas” (gas captured from municipal solid waste landfills, thermal gasification of municipal solid waste, anaerobic digestion of food waste, and gas from municipal water resource recovery facilities) capacity in Fairfax County to 30% of all natural gas use by 2030 and 98% by 2050. This strategy accounts for 7% of the emissions reduction needed to meet the 2050 CECAP goal.