RESILIENCE METRICS FOR COMMUNITY SERVICES
As the county builds resilience to climate change effects, addressing vulnerabilities of the population and boosting community services are top priorities. The population of Fairfax County is over 1.15 million and increasing. While all people can be vulnerable to climate-related hazards such as increasing levels of flooding, extreme heat, and severe storms, certain populations may be more vulnerable due to systemic inequities, historic underinvestment in neighborhoods, and personal factors such as health conditions and disabilities. To best serve these residents now and in the future, it is important to ensure that the county’s public services, such as health and community services, emergency response, parks and recreation, and waste management services, are also resilient to a changing climate.
This section of the dashboard highlights a few key metrics on community services related to climate resilience. For climate data and projections in general, please see the Overall Resilience Metrics page. For an interactive map of climate hazards and assets, please see the Resilient Fairfax Interactive Map Viewer. For more information on vulnerabilities, please see the Resilient Fairfax Climate Vulnerability and Risk Assessment (VRA). For more information on Resilient Fairfax and what Fairfax County is doing to address these issues, please see the Resilient Fairfax website.
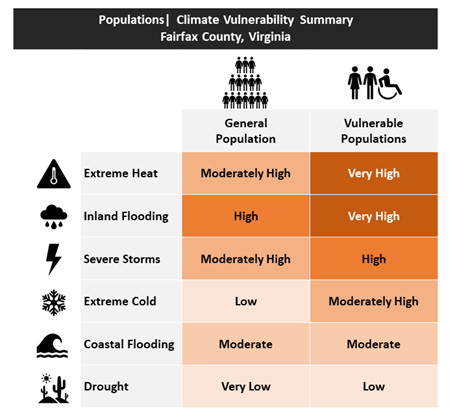
As summarized in Populations figure below, vulnerable populations in Fairfax County (defined by One Fairfax) have “very high” vulnerability to extreme heat and inland flooding, and “high” vulnerability to severe storms. The general population is also vulnerable to these impacts, but to a lesser degree. These vulnerability scores were based on a combination of exposure (how exposed is the population the hazard, and is that hazard increasing or decreasing?), sensitivity (when the population is exposed, does something bad happen?), and adaptive capacity (can the population adapt to changing conditions?).
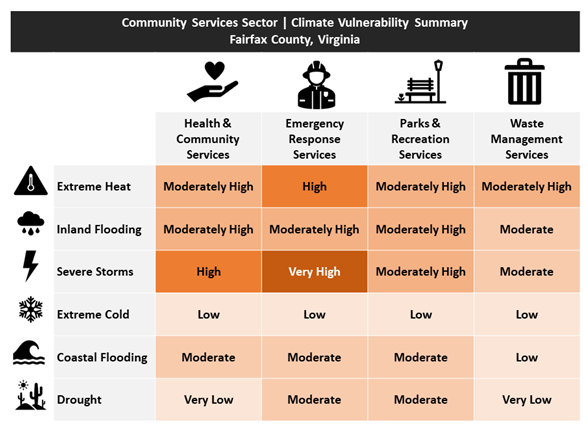
As summarized in Community Services figure below, certain public services also have opportunities to boost their resilience to ensure they can continue operating at full capacity when they are needed most. In particular, emergency response services have a very high vulnerability to severe storms, high vulnerability to extreme heat, and moderately high vulnerability to inland flooding. Health and community services have high vulnerability to severe storms and moderately high vulnerability to extreme heat and inland flooding. A few key metrics relating to these vulnerabilities and services can be found below. Detailed descriptions can be found in the Climate Vulnerability and Risk Assessment.
Community Services Metrics for Extreme Heat
Urban Heat Islands
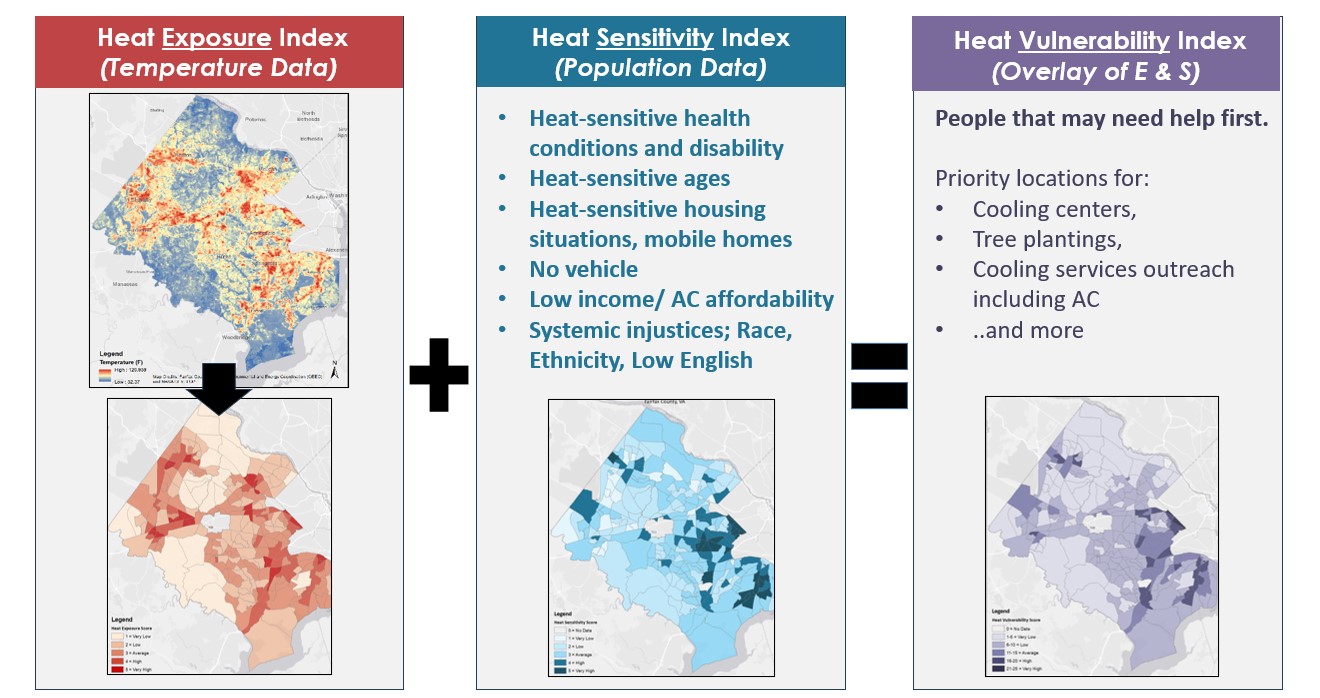
On extreme heat days, people are at risk for heat-related illnesses such as heat exhaustion, heat stroke, dehydration, and cardiovascular, respiratory, and cerebrovascular disease. While extreme heat affects everyone, people living or working in Urban Heat Islands have even higher exposure to dangerous temperatures, because temperatures are significantly higher in those parts of Fairfax County. Additionally, certain populations may have higher sensitivity to extreme heat, due to health conditions, disability, age, inability to afford air conditioning, outdoor employment, or other factors. To ensure those who need the most help during extreme heat receive help, the county prioritizes areas of the county where community members are both more exposed and more sensitive to extreme heat. First, land surface temperatures were summarized by Census Tract to make population data analyses easier, as shown in the figure below.
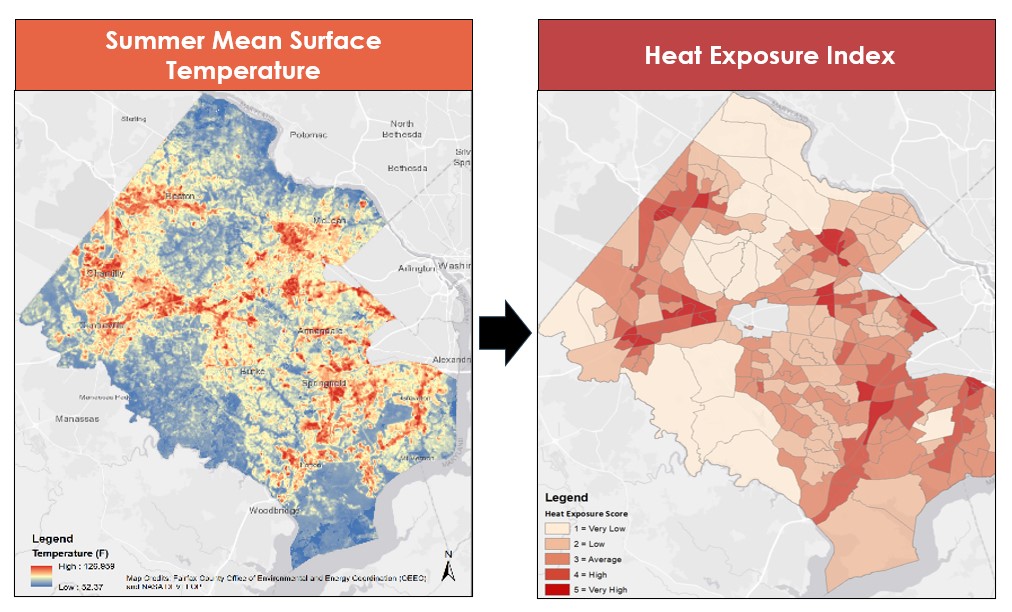
Next, the temperature data (Heat Exposure Index) was overlaid with demographic data (Heat Sensitivity Index) to find areas that are more vulnerable to heat overall. (For an interactive map of these data, please see the Resilient Fairfax Interactive Map Viewer.)
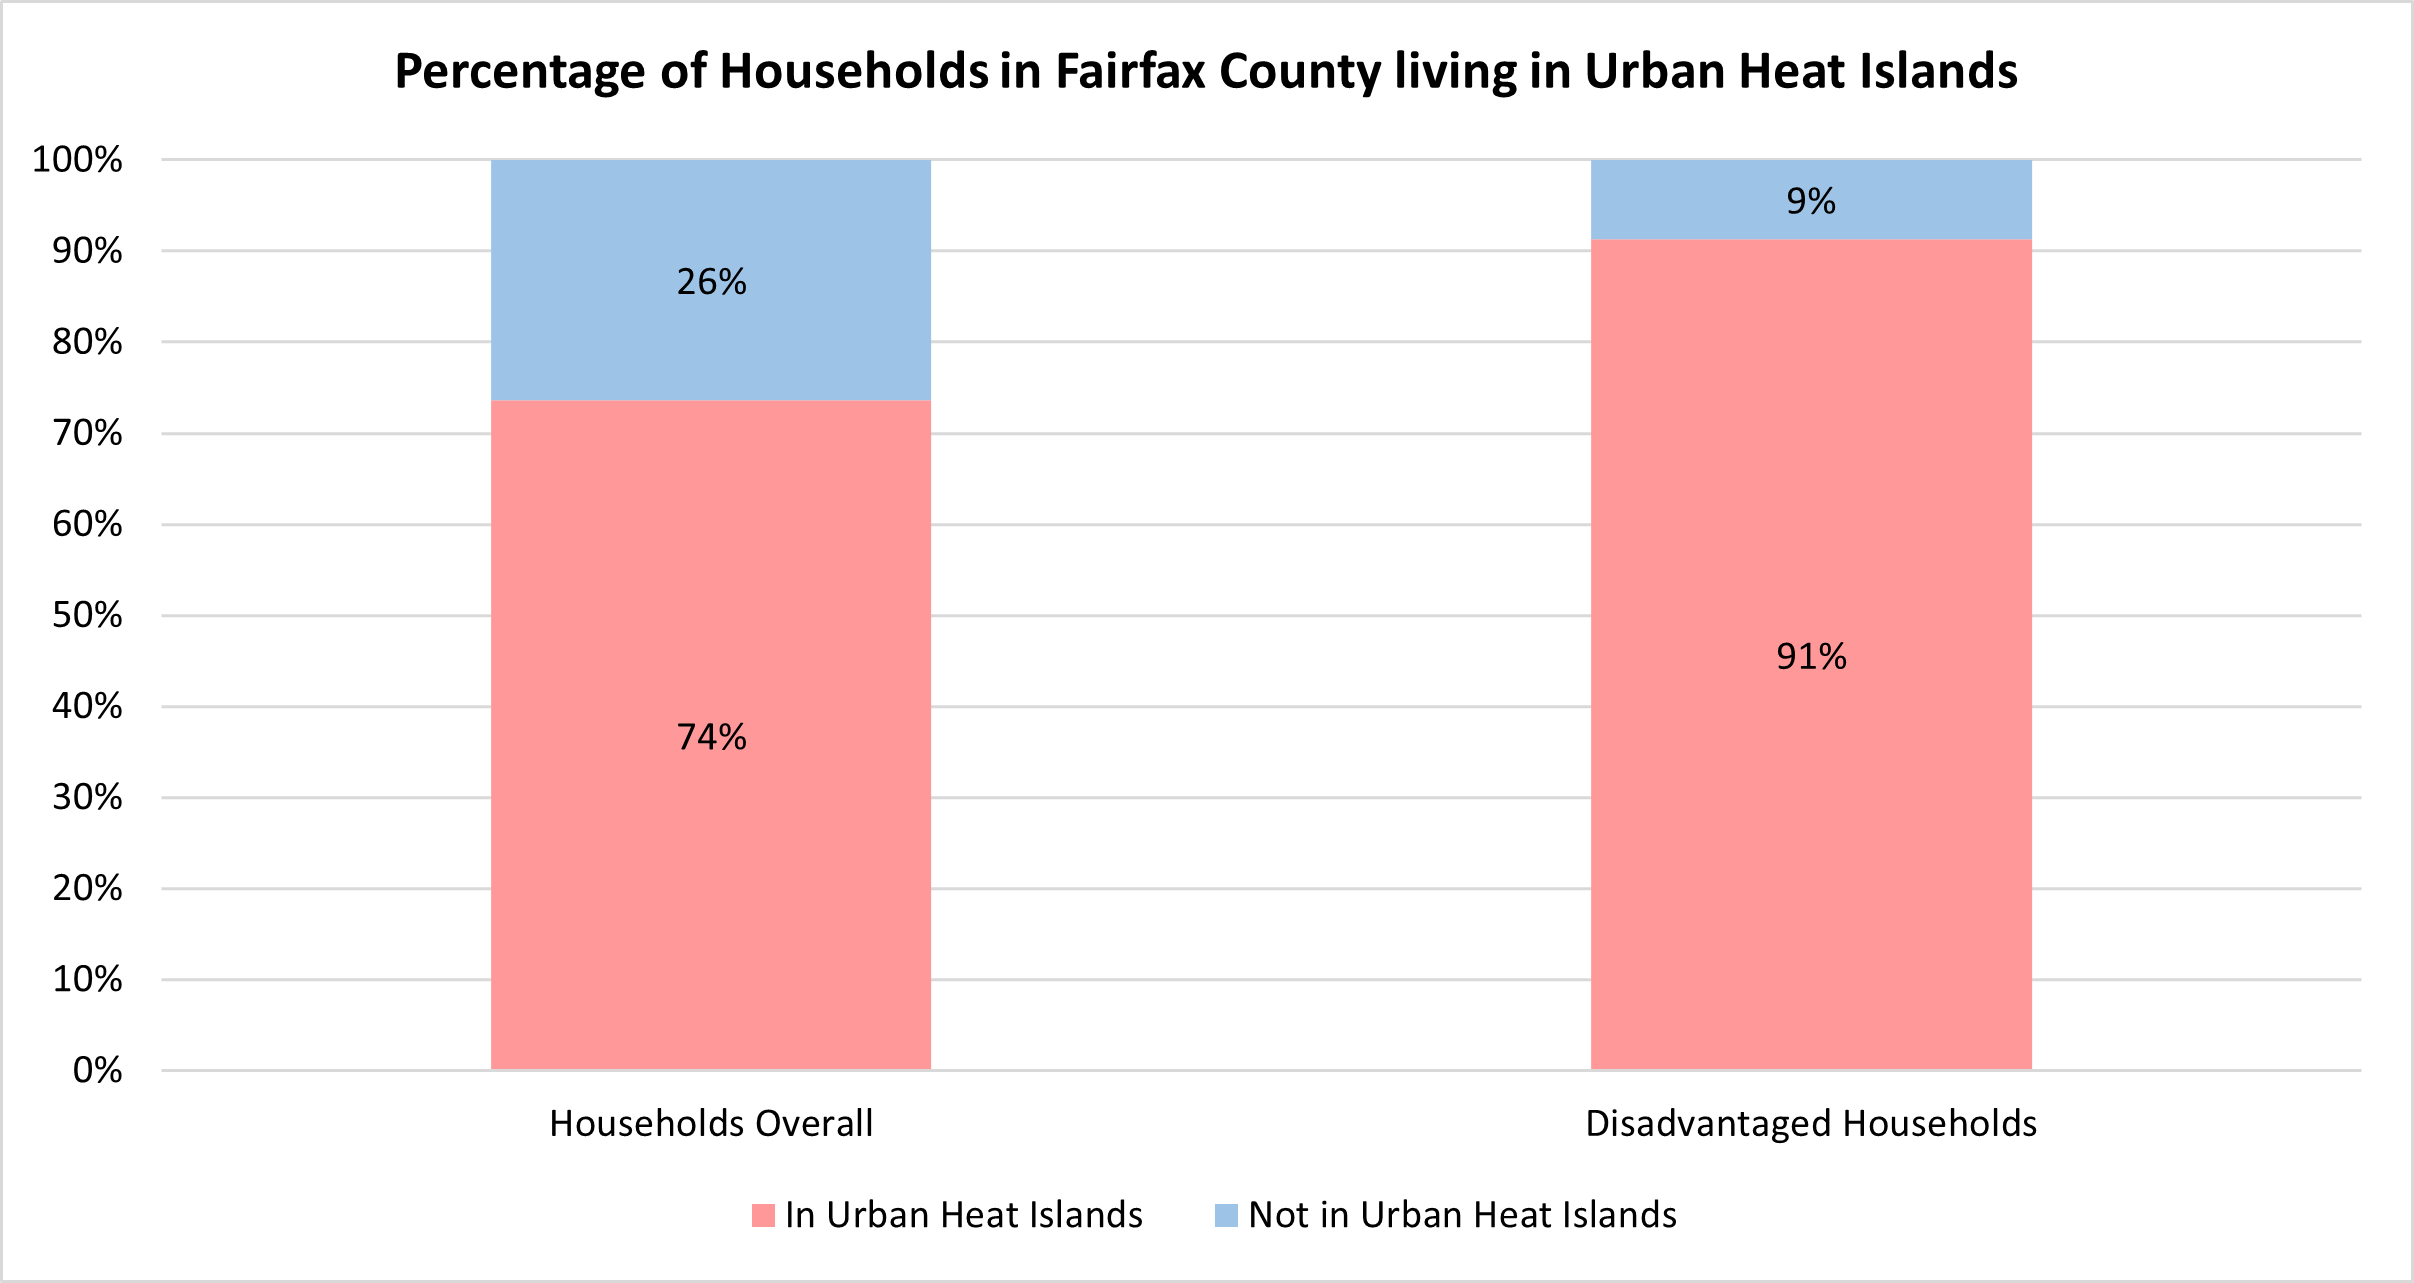
As can be seen in the chart below, the burden of living in Urban Heat Islands is not shared evenly. As a result of systemic injustices, underinvestment, and lack of green space in lower-income neighborhoods, and households that are already disadvantaged due to socioeconomic, demographic, and health related factors are also more likely to live in Urban Heat Islands.
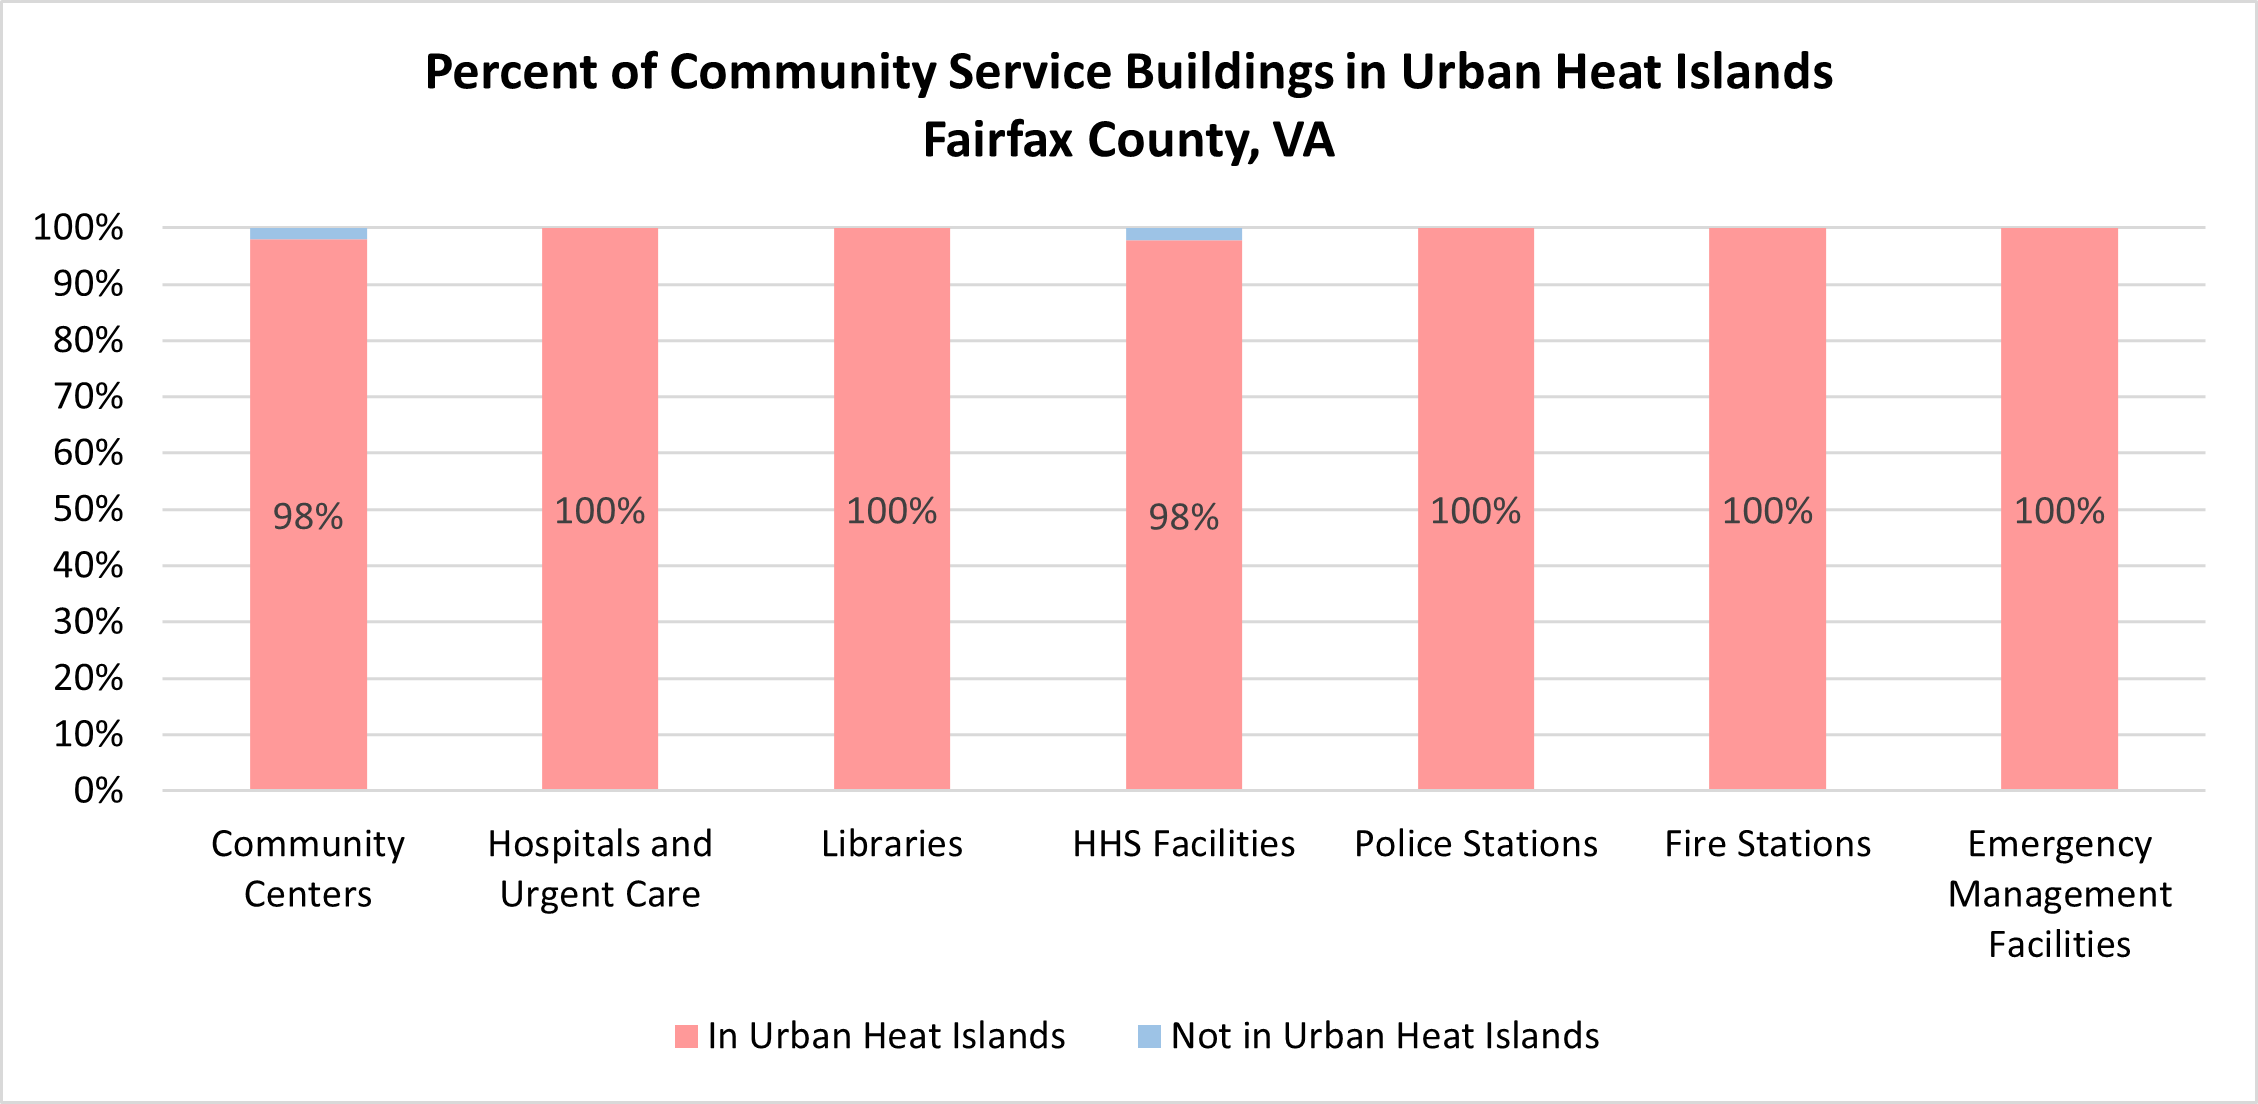
As shown in the chart below, almost all of Fairfax County community service provider buildings are also located in Urban Heat Islands. Specifically, 98% of community centers, 100% of hospitals and urgent care facilities, 100% of libraries, 97.8% of HHS facilities, 100% of police stations, 100% of fire stations, and 100% of emergency management facilities are in Urban Heat Islands, where green space is scarce and summer daytime temperatures are significantly hotter than other areas of the county. There are opportunities to improve the design of these buildings and sites to be more heat-resilient through things like cool roofs, cool walls, cool pavements, shade structures, passive cooling, window shading, and shade tree plantings. When service provider buildings are more heat-resilient, they can remain cooler and safer during power outages, and they have significantly lower air conditioning costs.
Heat-Related Hospitalizations
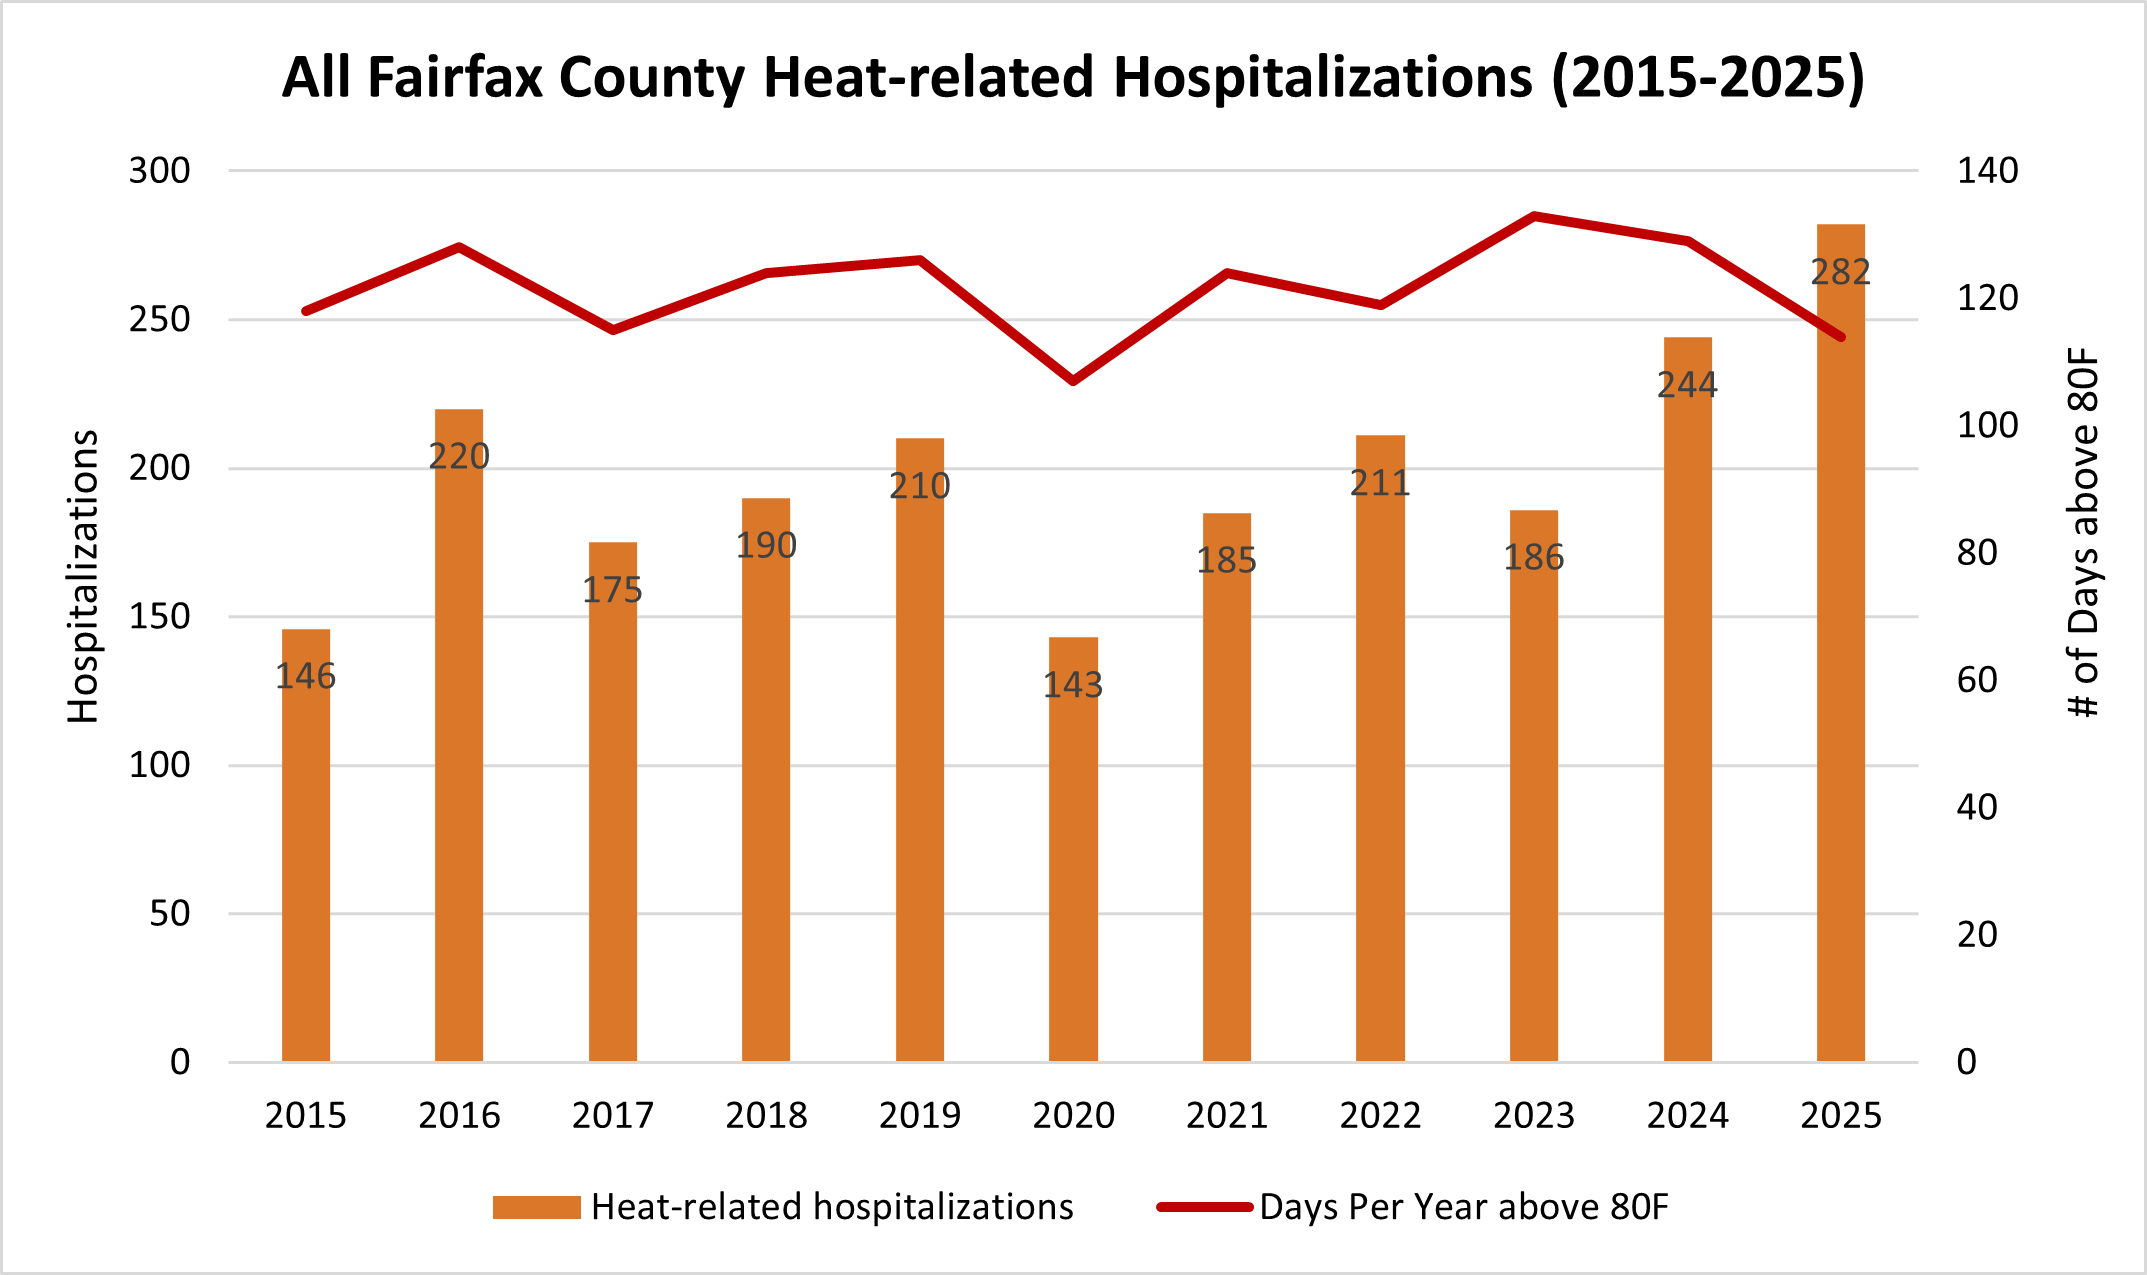
It is also important to track heat-related hospitalizations, or the number of people who are hospitalized due to heat stroke, heat exhaustion, or other heat-related illnesses. As shown in chart below, heat-related hospitalizations align closely with the number of hot days per year, as would be expected (Hospitalization data courtesy of the Fairfax County Health Department.) To see temperature trends overall, please see the Overall Resilience Metrics page of the dashboard.
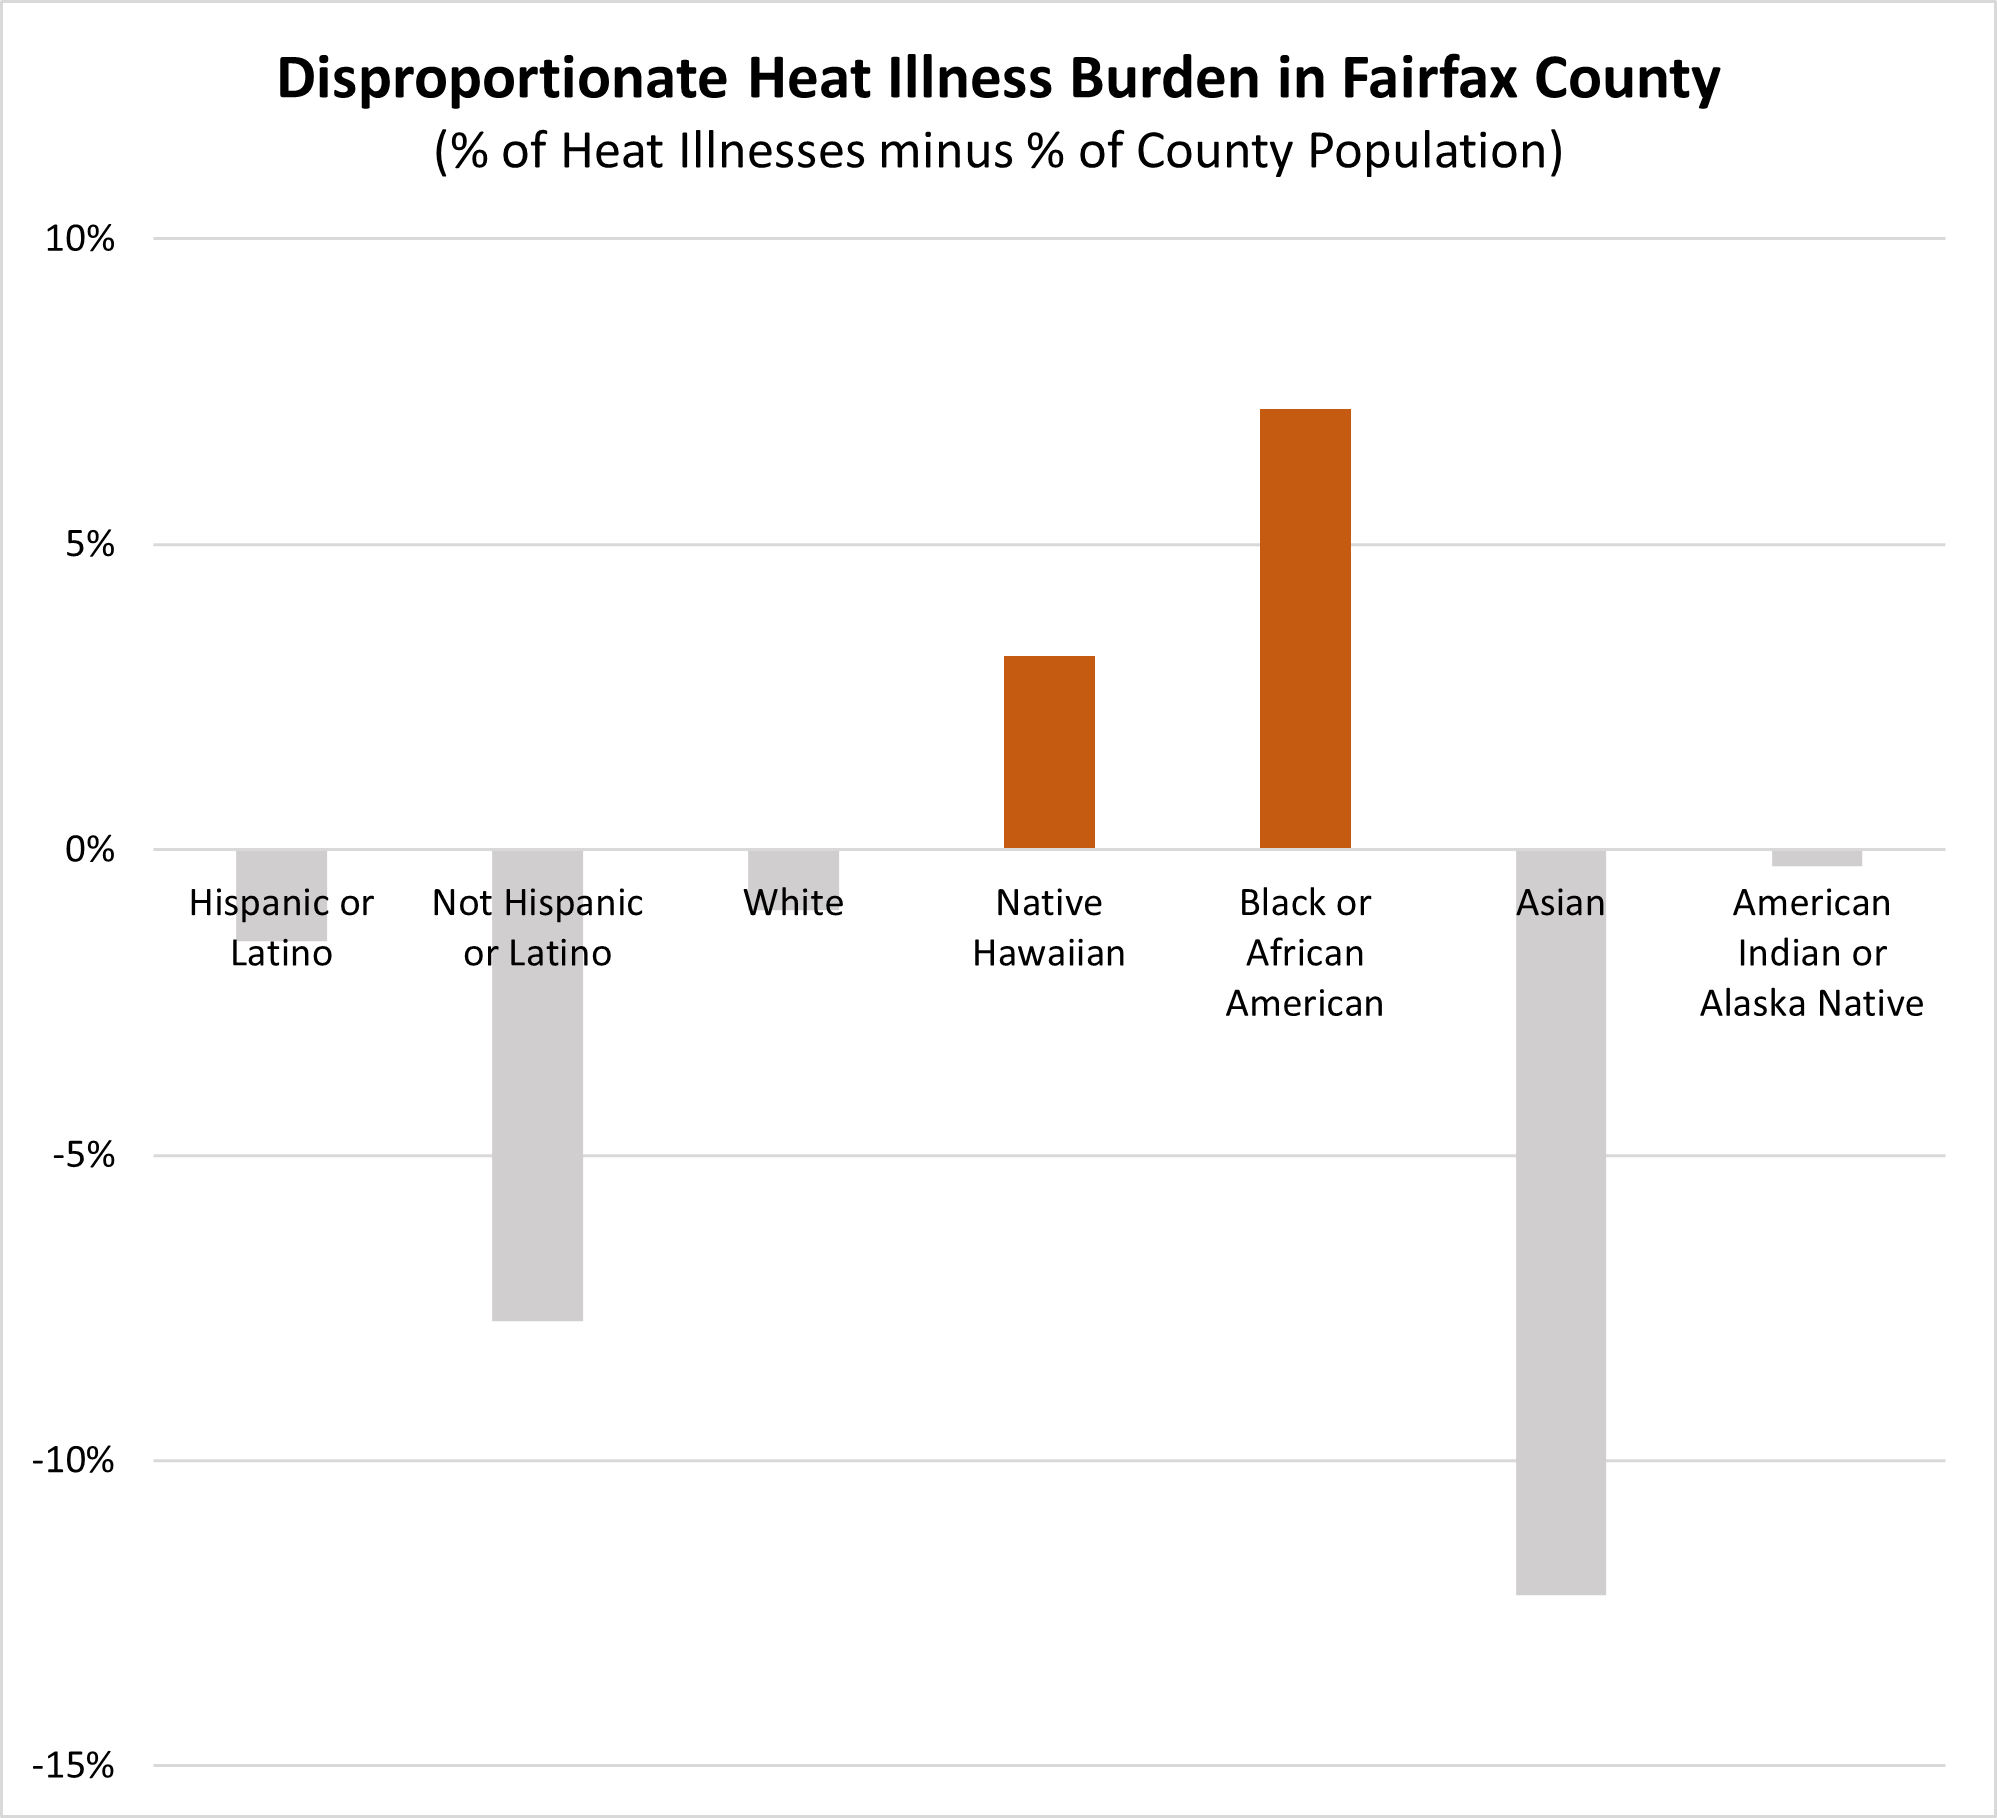
The burden of heat-related hospitalizations is not spread evenly across the county’s population. As shown in the chart below, Black residents and Native Hawaiian residents disproportionately experience heat-related hospitalizations on average. Black residents make up only 9.8% of the population, but 16.9% of heat-related hospitalizations. Native Hawaiian residents make up less than 0.1% of the population but account for 3.5% of heat-related hospitalizations. The other demographic groups in Fairfax County have a disproportionately smaller share of the heat-related hospitalizations. Outdoor workers, those in substandard housing, and those without access to air conditioning are at especially high risk for heat-related illnesses.
It should be noted that historically, “Hispanic or Latino” was defined by the U.S .Census as an ethnicity rather than a race, which means it was counted separately. The U.S. Census Bureau has now updated Race/Ethnicity definitions, which are planned to be implemented in the 2027 American Community Survey and the 2030 Census. Demographic data comes from American Community Survey 1-Year Estimates, which is only available for 2024, whereas local heat illness data is available through 2025.
Cooling Centers
The county works to prevent heat-related illnesses in several ways, including Cooling Centers and other heat-related emergency resources. The county’s 47 enhanced Cooling Centers offer space to cool down in the air conditioning, supplies to keep safe outside, and information on relevant public services. Staff distribute supplies to visitors, including sunscreen packets, reusable water bottles, cooling towels, and battery powered fans. Additionally, transportation assistance is provided for access to the Cooling Centers, and Connector Ride Passes are distributed on site.
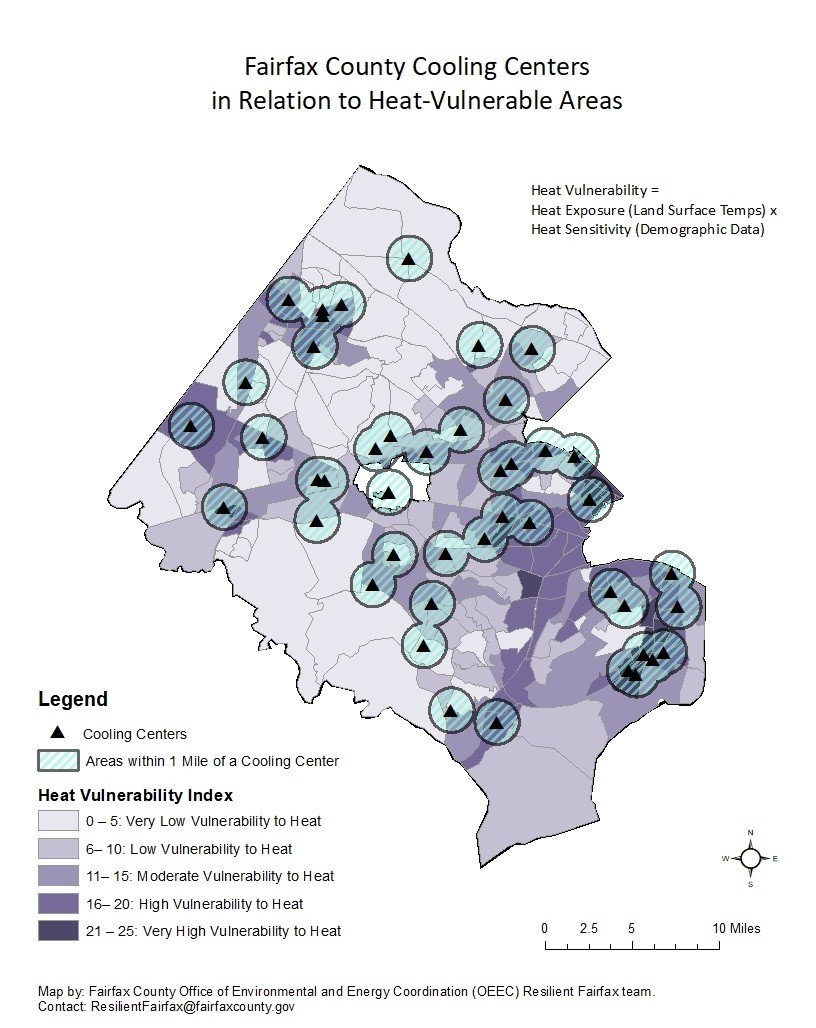
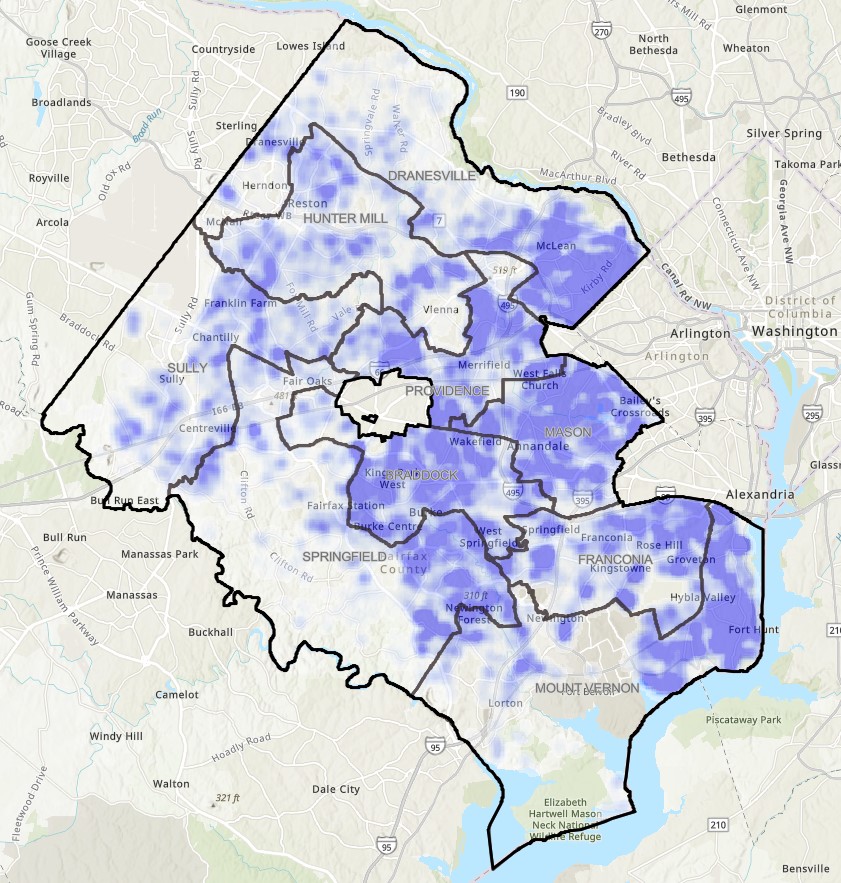
Cooling Centers may be most needed in Heat-Vulnerable areas. The map below shows the locations of the county’s Cooling Centers in relation to the Heat Vulnerable Areas. The Heat Vulnerable areas are the darkest purple Census Tracts. The Cooling Centers are shown as triangles. The hatched circles around each Cooling Center show areas that are within 1 mile of that Cooling Center. Disclaimer: these circles do not account for specific driving or walking routes. Generally speaking, the cooling centers are located in the right places. Currently, 84% of the county’s most heat-vulnerable areas have a Cooling Center nearby. (For more on the Heat Vulnerability Index, please see the “Urban Heat Island” section above.)
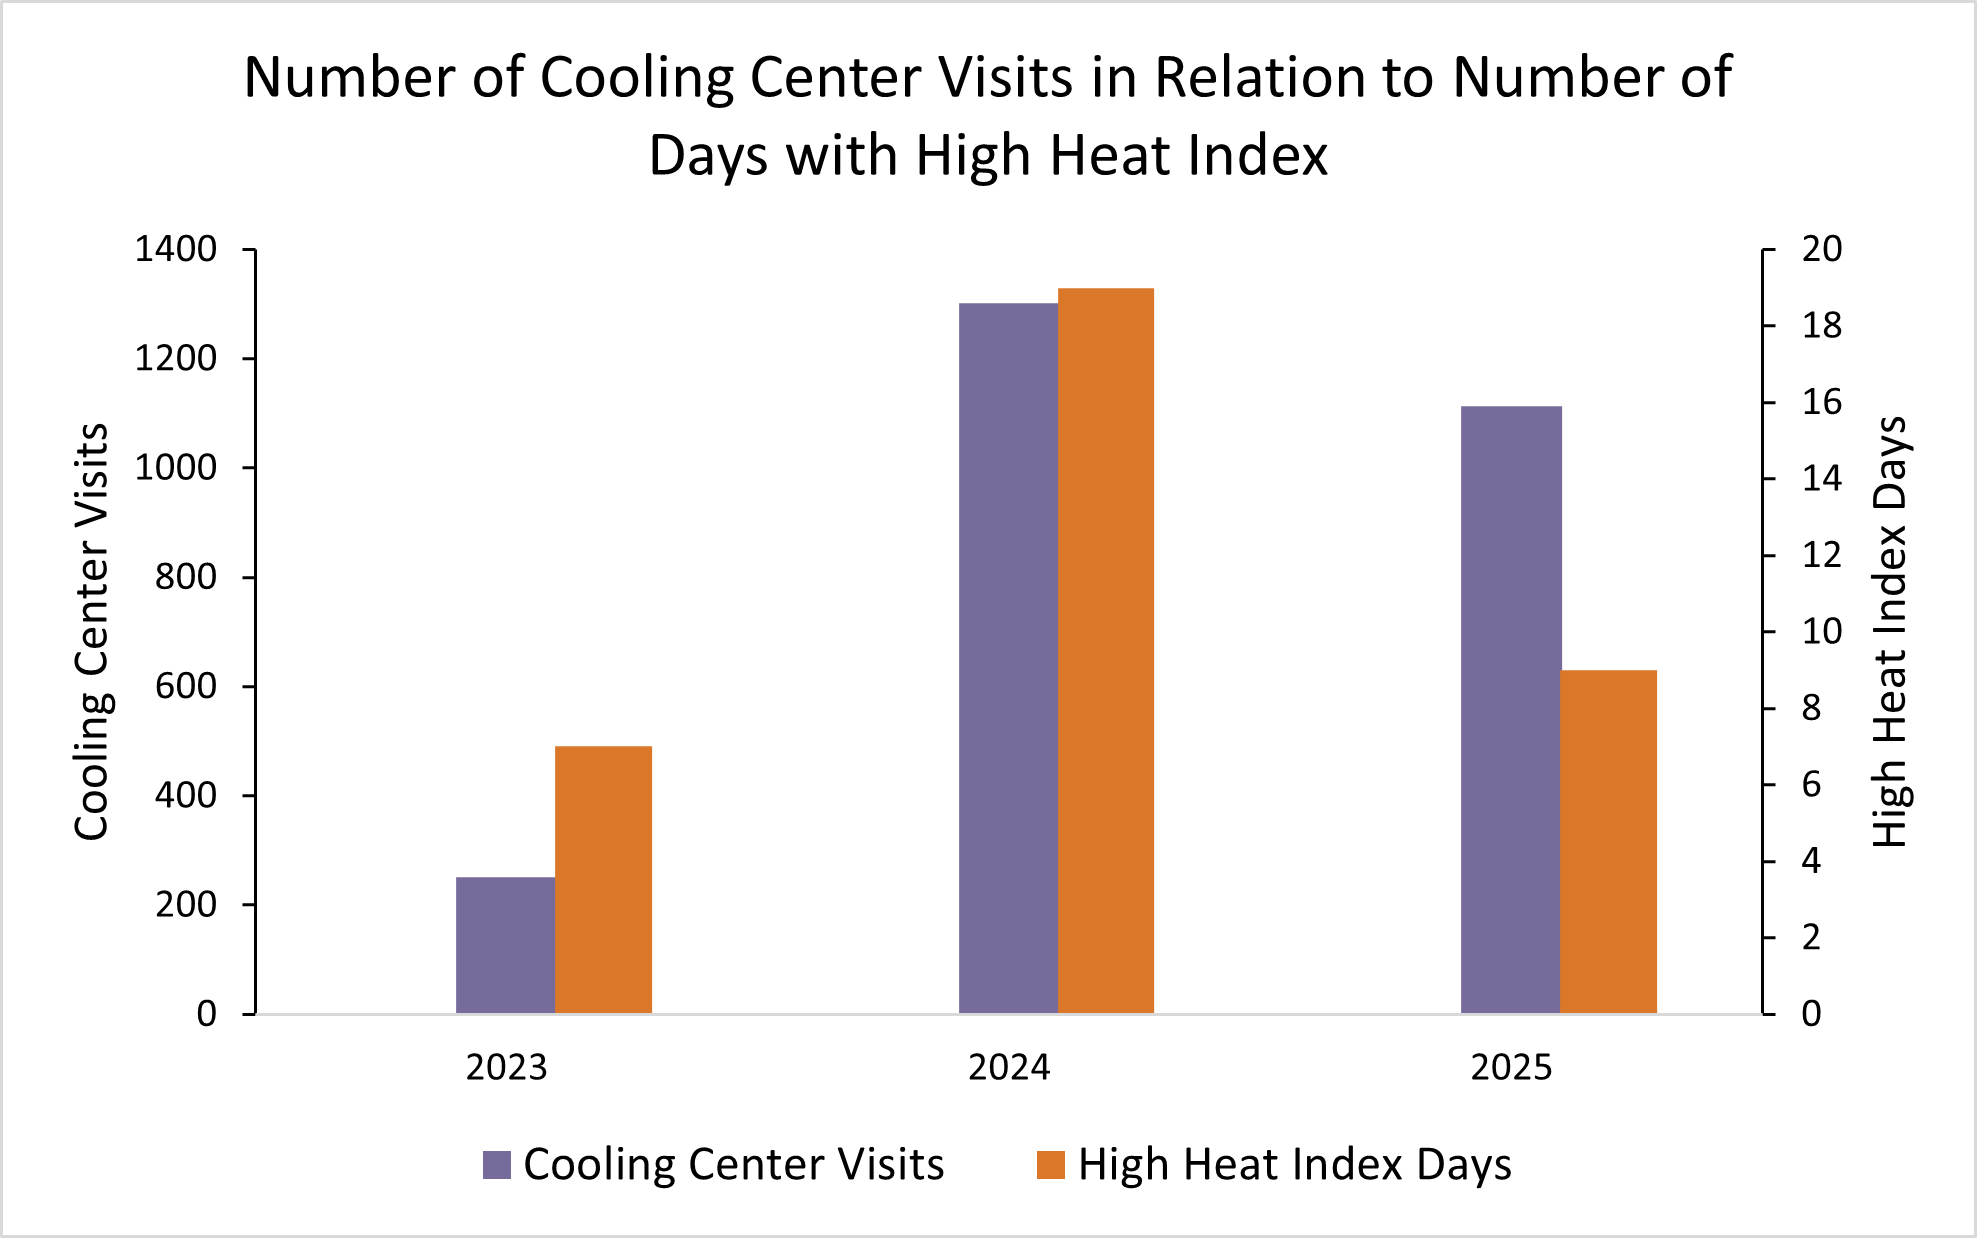
In 2023, the first year of the enhanced Cooling Centers, there were 7 days in which the National Weather Service (NWS) issued a heat advisory or extreme heat warning* and 251 visits to Cooling Centers were recorded during heat emergencies, as shown in the chart below. In 2024, there were 19 days in which a heat advisory or an excessive heat warning was issued, and 1,301 visits to cooling centers were recorded. This pattern shows that as expected, Cooling Center usage increases sharply when extreme heat days increase. In 2025, there were 9 high heat index days and 1,113 visits to cooling centers. This pattern shows that as expected, Cooling Center usage increases sharply when extreme heat days increase.
*A heat advisory is issued when the heat index value (temperature plus humidity) is expected to reach 105-109 within the next 12-24 hours. An extreme heat warning is issued when the heat index value is expected to reach 110+ within the next 12-24 hours.
Air Conditioning at Home
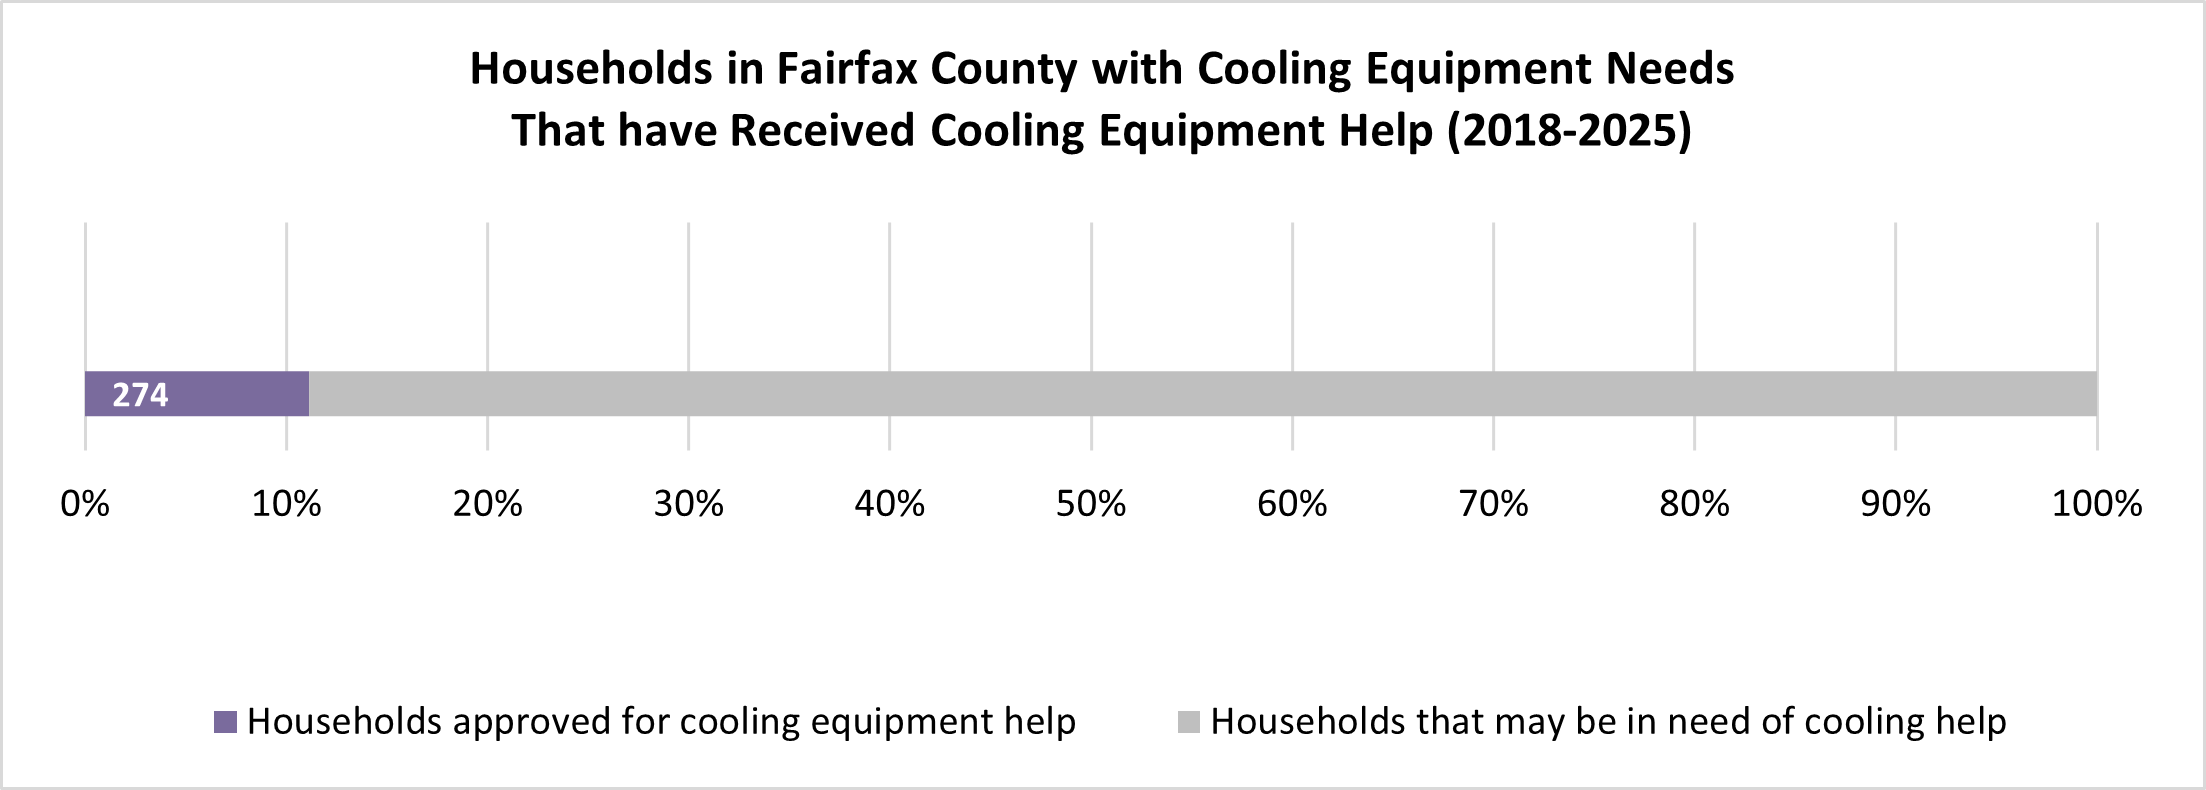
Access to air conditioning at home is critical to keeping residents safe in increasingly warm temperatures, preventing heat-related illnesses and fatalities. Fairfax County has three cooling programs: Cooling Assistance, Senior Cool Care, and AC Rescue. These programs have different requirements and areas of focus. AC Rescue was created in 2024 as part of the implementation of Resilient Fairfax to complement the other programs by filling gaps and serving populations unable to receive assistance from the other programs. For more information on the differences between these programs, please see the AC Rescue webpage. The chart below shows the number of households served with air conditioning equipment help since 2018. Equipment help includes air conditioning installations, drop-offs, repairs, and replacements.
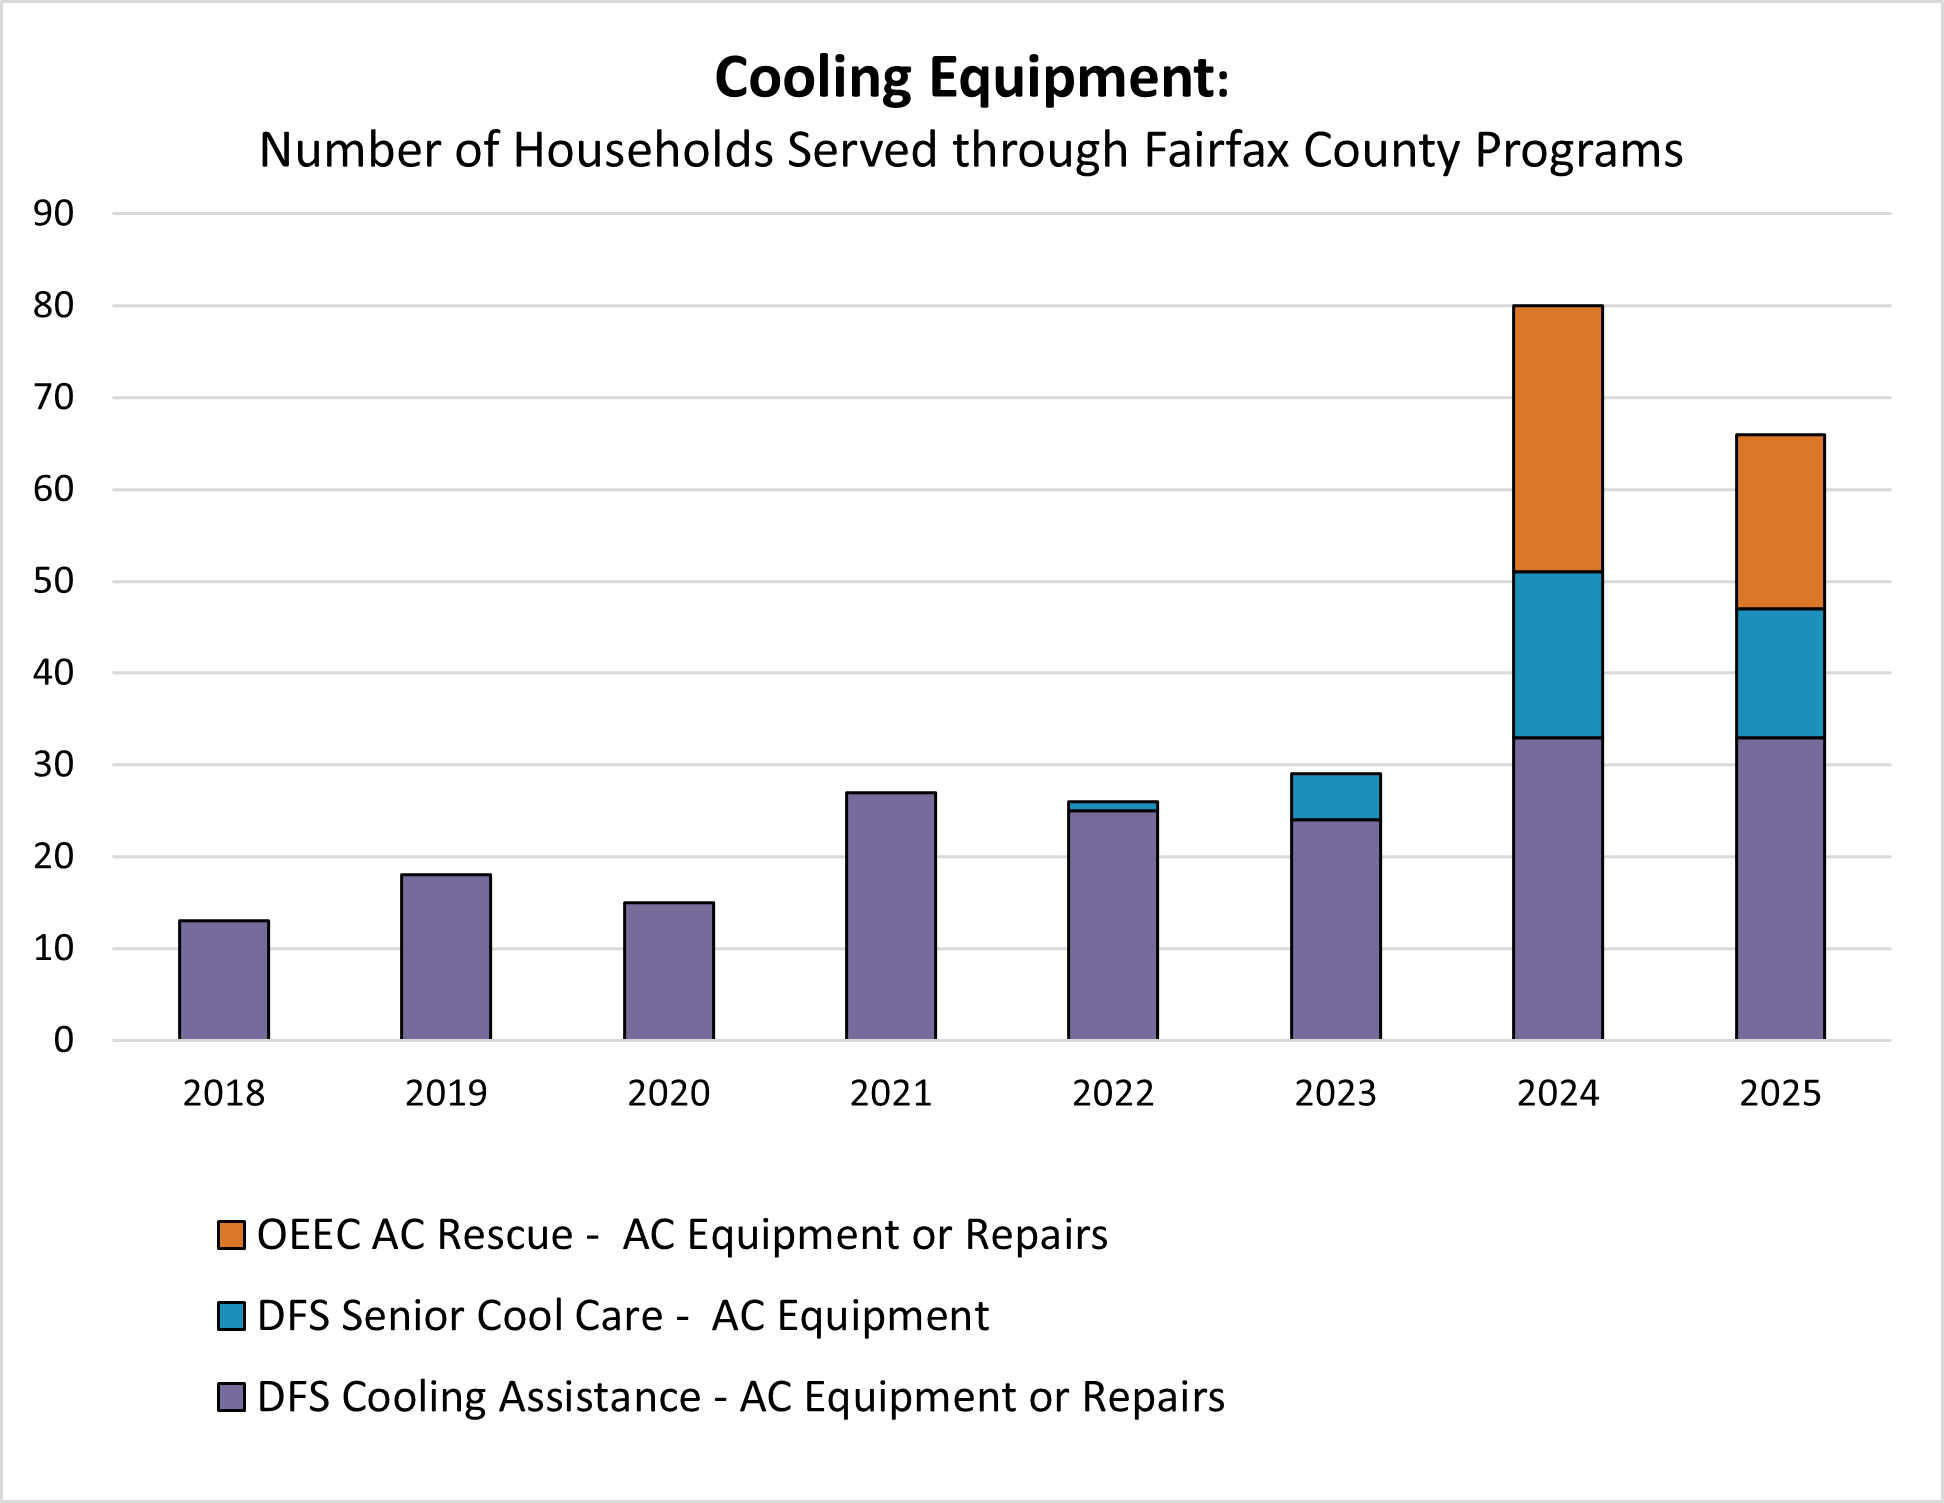
It is also important to assess how much of the total potential need is being met. An estimated 2,460 households in Fairfax County may lack sufficient cooling equipment at home, based on OEEC’s analysis of Department of Tax Administration (DTA) data on HVAC systems. (The existence or absence of HVAC systems are part of what determines the tax value of a building.) Of these 2,460 households, 274 households (or 11.1%) have received AC equipment help from the county’s cooling programs. It is important to note that these statistics are for equipment only. Financial assistance such as bill payment help is not included in the charts.
For heat data and temperature projections in general, please see the Overall Resilience Metrics page. For an interactive map of climate hazards and assets, please see the Resilient Fairfax Interactive Map Viewer. For more information on vulnerabilities, please see the Resilient Fairfax Climate Vulnerability and Risk Assessment (VRA). For more information on Resilient Fairfax and what Fairfax County is doing to address these issues, please see the Resilient Fairfax website.
Community Services Metrics for Flooding
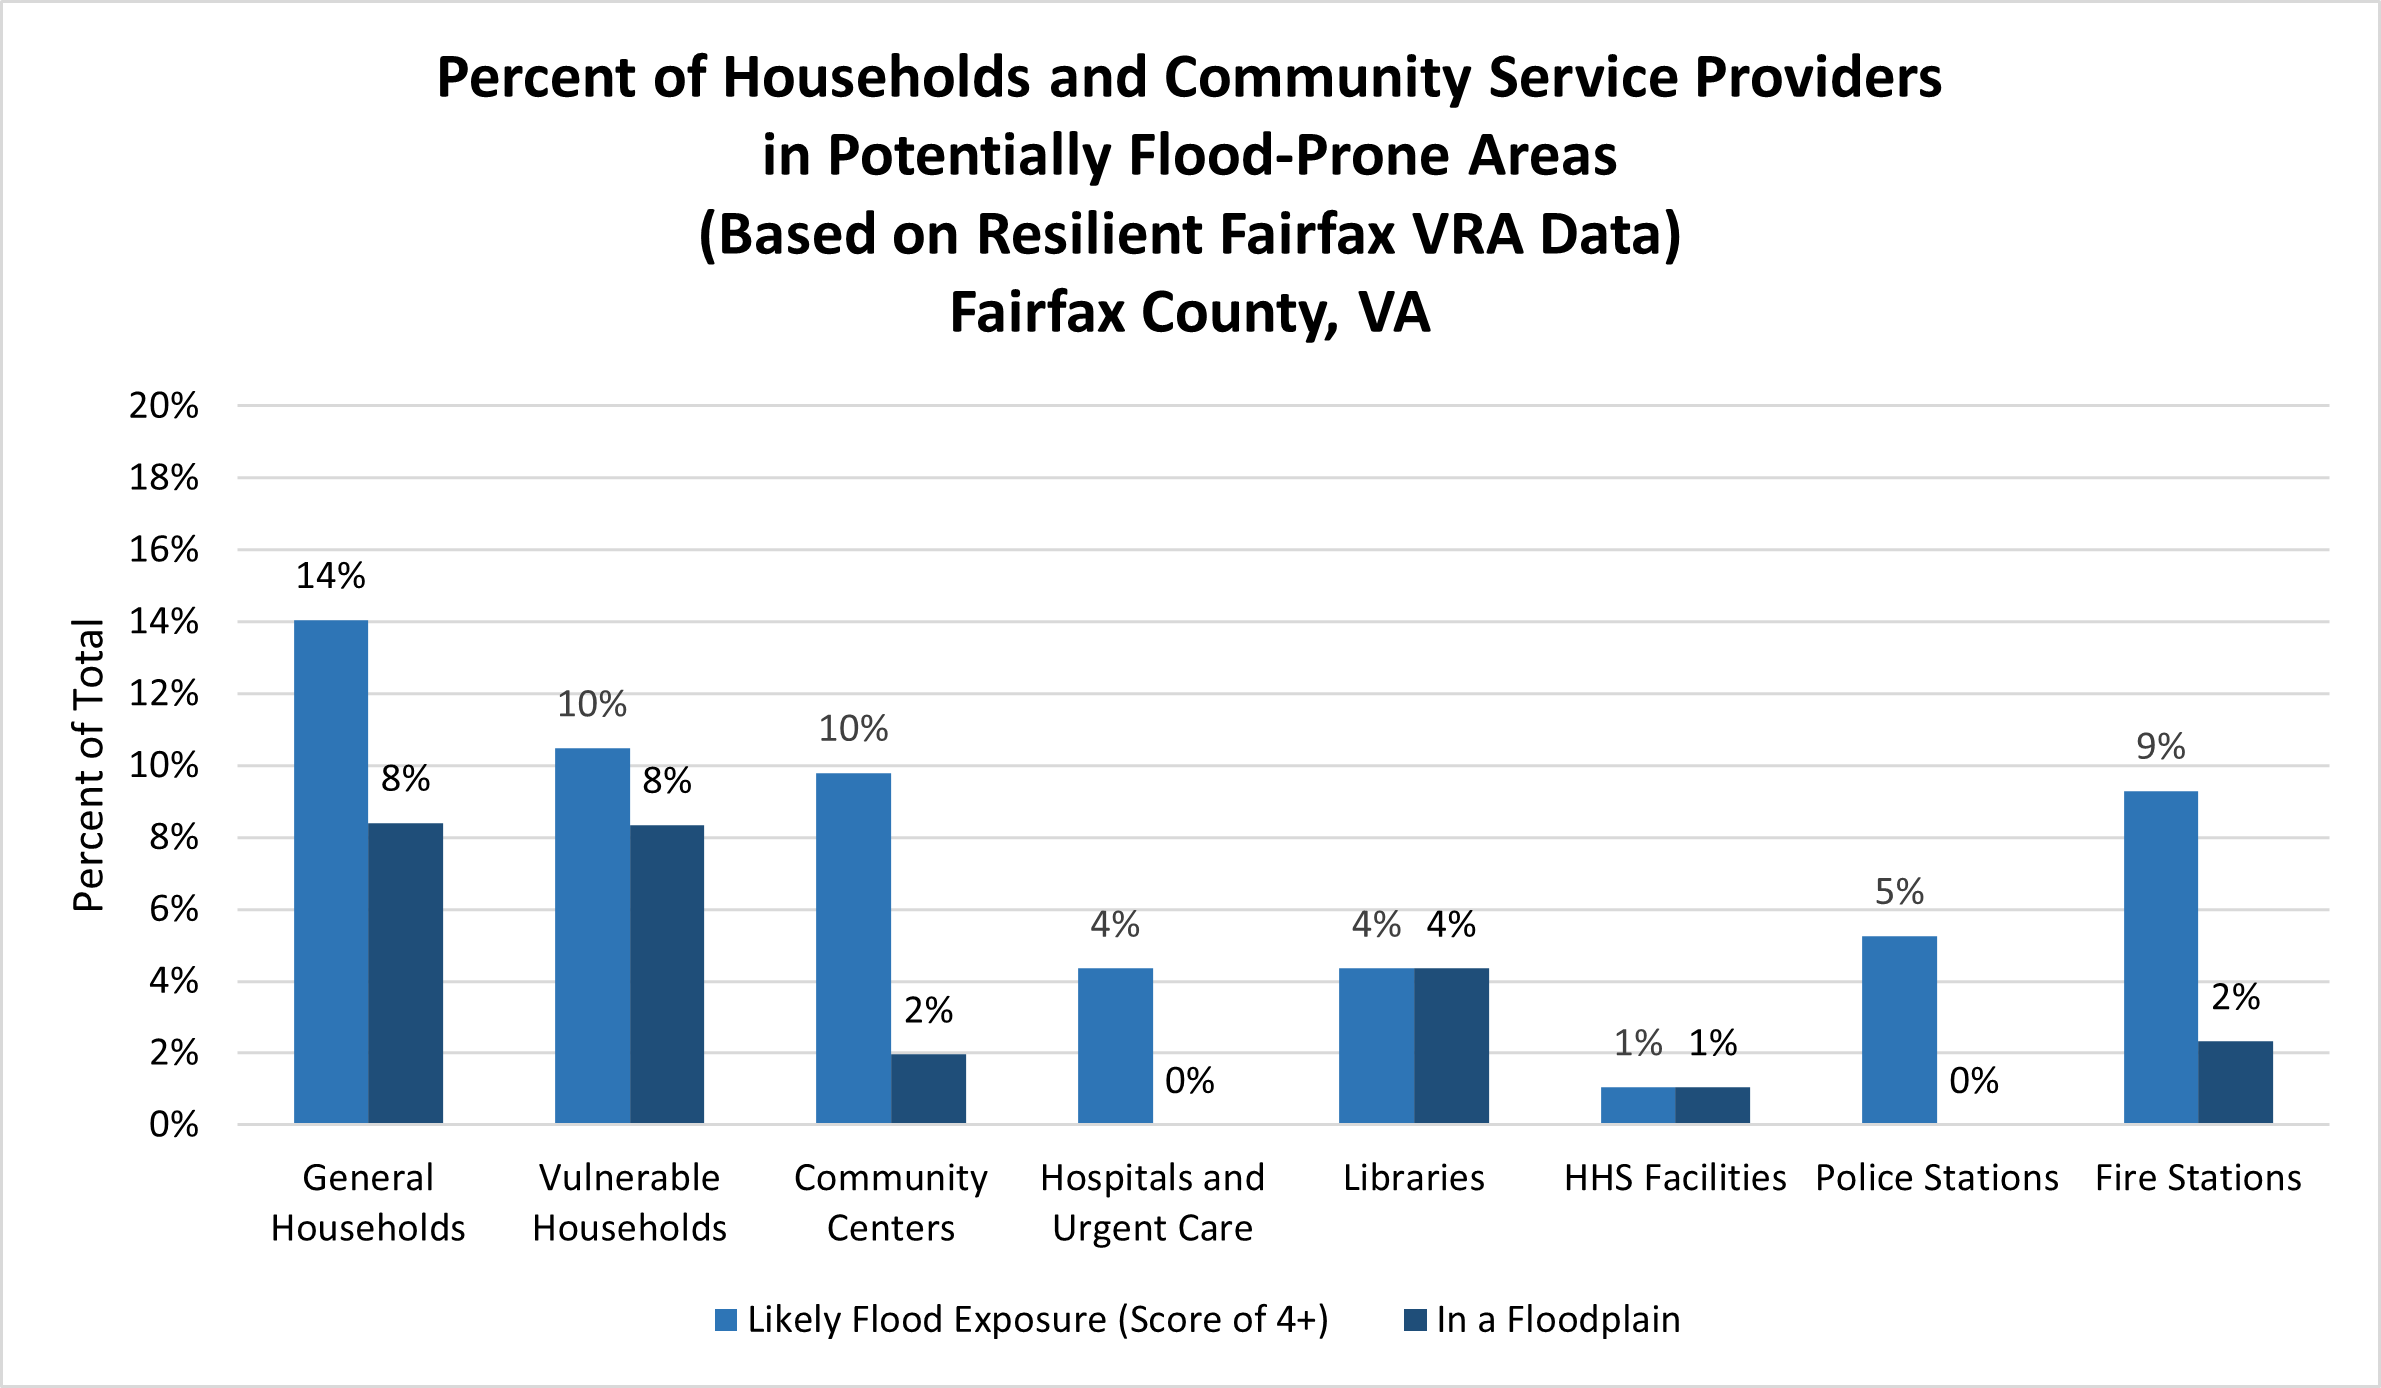
As summarized in the chart below, the Fairfax County population and the public facilities that serve them have varying exposure to flooding. The Resilient Fairfax data shown below were based on a property-by-property analysis to find areas that may be flood-prone. The properties were scored for 10 flood-prone factors, including proximity to county floodplains, proximity to FEMA floodplains, proximity to streams, parcel location in sump, structure location in sump, subdivision age, absence of stormwater infrastructure, location outside a Facility Drainage Area, infill lots, and history of flooding-related service requests. For example, a score of four would mean that the property has four of the ten factors that could make it prone to flooding. Properties that have four or more flood-prone factors are shown in the chart. To clarify how many of those facilities are vulnerable due to floodplain exposure specifically, a bar for floodplains is shown in dark blue for each item. Approximately 14% of general households, 11% of vulnerable households, 10% of community centers, 4% of hospitals, 4% of libraries, 1% of HHS facilities, 5% of police stations, and 9% of fire stations may be exposed to flooding based on this analysis.
It should be noted that the Department of Public Works and Environmental Services (DPWES) is conducting additional analyses on flood-prone properties, based on four scenarios rather than ten factors. However, these data are not yet broken down by community facility type, so the ten-factor analysis is still shown below. For more information on stormwater, please visit Stormwater Management.
DPWES Service Requests
Residents experiencing certain flooding issues can contact the Department of Public Works and Environmental Services (DPWES) to request service. The figure below uses data from DPWES to illustrate the location of service requests by Supervisor District. DPWES investigates 100% of service requests. It is important to note that a higher number of service requests does not always mean a higher presence of flooding issues. It could also mean higher awareness in that District that the service exists. Residents experiencing flooding issues who do not know how to request DPWES services would not be shown in the data. (To submit a service request, visit the Report a Problem page).
Community Flooding and Stormwater Management Programs
Flood Mitigation Assistance Program (FMAP)
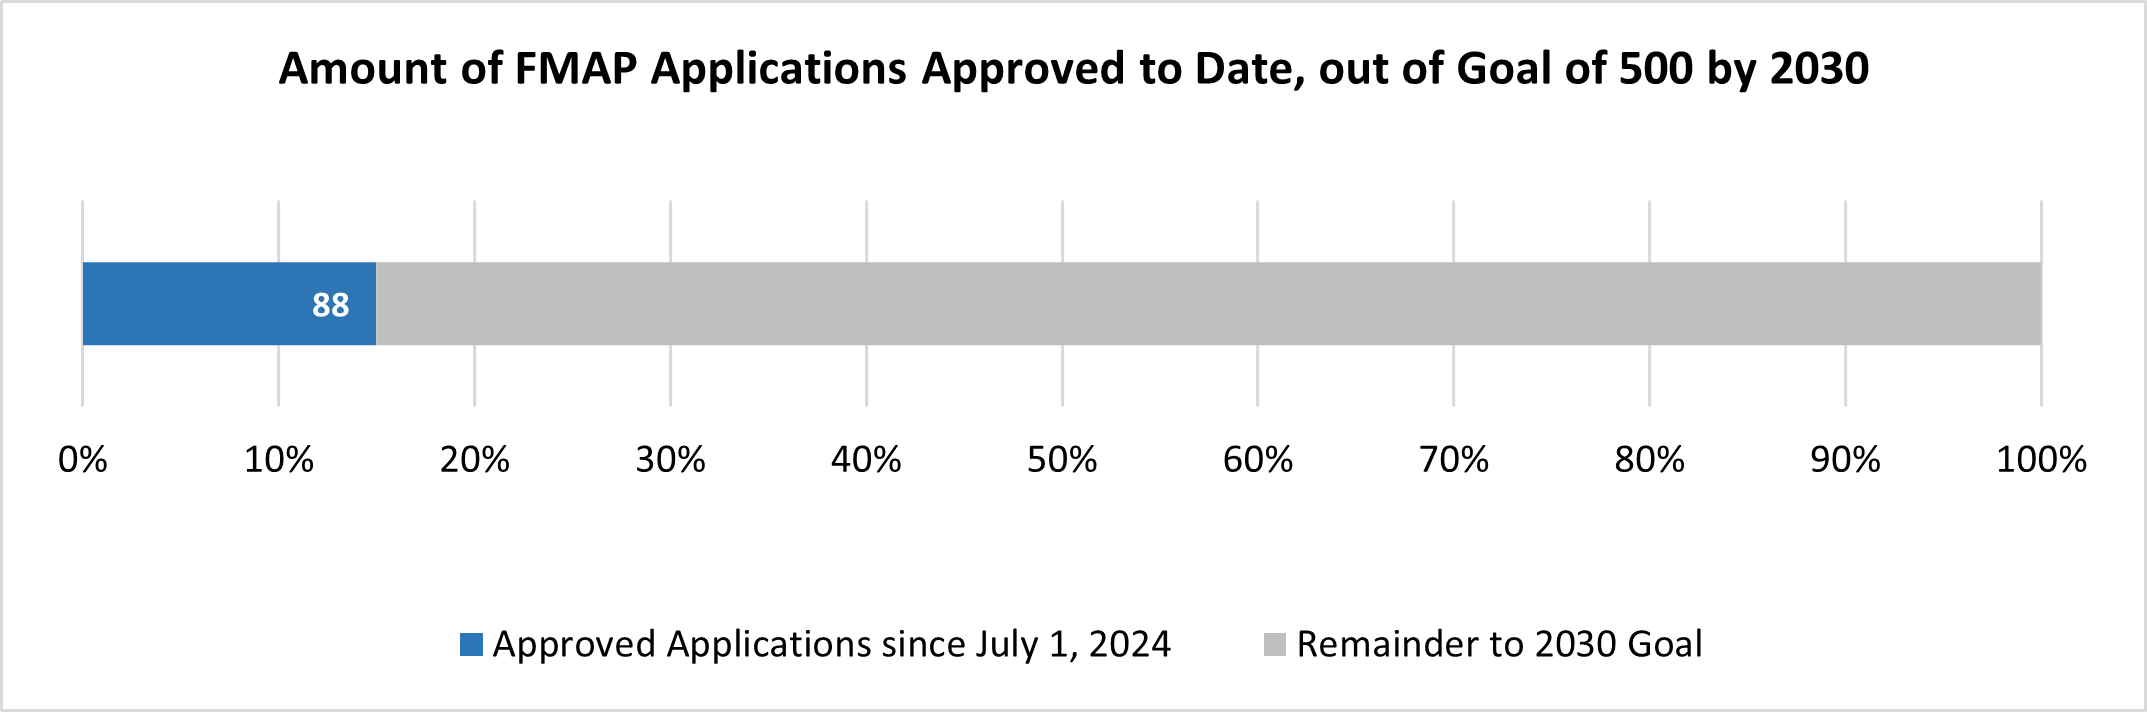
The DPWES Stormwater Service District also funds the Flood Mitigation Assistance Program (FMAP) to help residents reduce their flooding risk. Through FMAP, applicants can receive 50% reimbursements (up to $5,000) for flood-proofing practices installed in their homes such as floodproof windows, basement window covers, flood gates, sandless sandbags, sump pump back-up power, utility flood covers, elevation of HVAC, and more. Northern Virginia Soil and Water Conservation District (NVSWCD) administers the program and provides a list of approved Flood Proofing Practices.
Since starting on July 1, 2024, the program has received 88 total applications and disbursed more than $250,000 in reimbursement monies, with an average reimbursement of $2,862 per applicant.
Conservation Assistance Program (CAP)
In addition to FMAP, NVSWCD continues to offer the Conservation Assistance Program (CAP) which helps residents address stormwater concerns on their property using environmentally friendly practices. Property owners can implement projects in their yards like bioretention, rain gardens, impervious surface removal and more. In 2025, NVSWCD staff approved 63 project applications and conducted 150 site visits. In the community, 53 projects were installed.