Office of Environmental and Energy Coordination

CONTACT INFORMATION: Our office is open to visitors by appointment only. Please call or email from 8:00 a.m. - 4:30 p.m., Monday through Friday.
703-324-7136 TTY 711
12000 Government Center Pkwy, Suite 533
Fairfax, VA 22035
John Morrill
Director

Overall Emissions Metrics

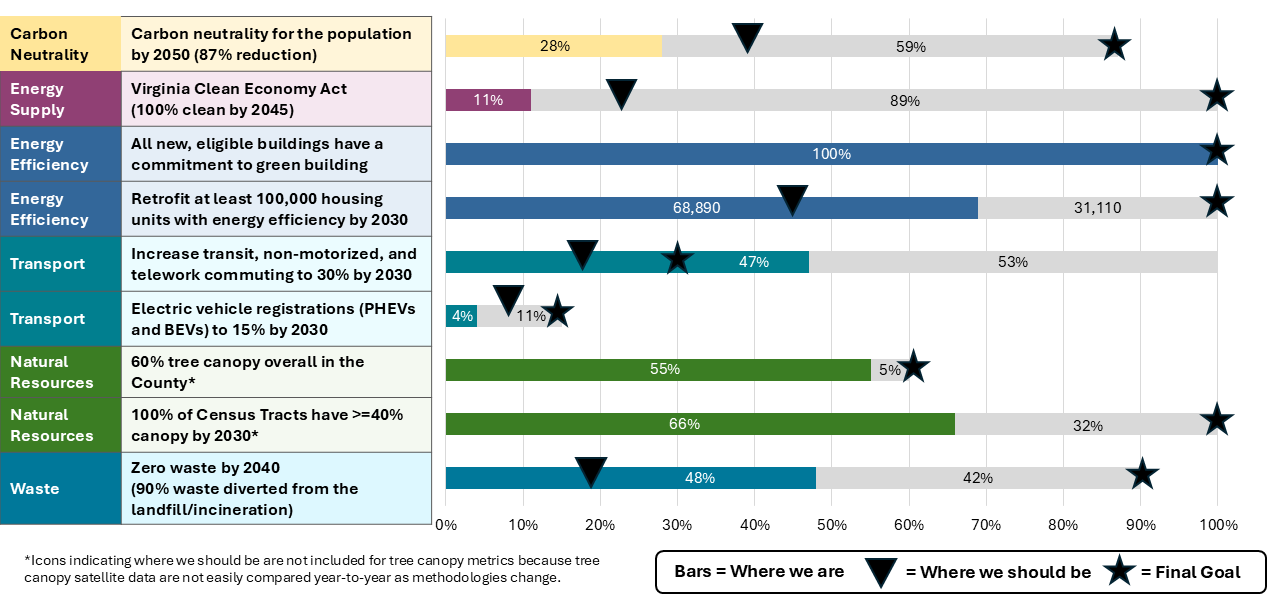
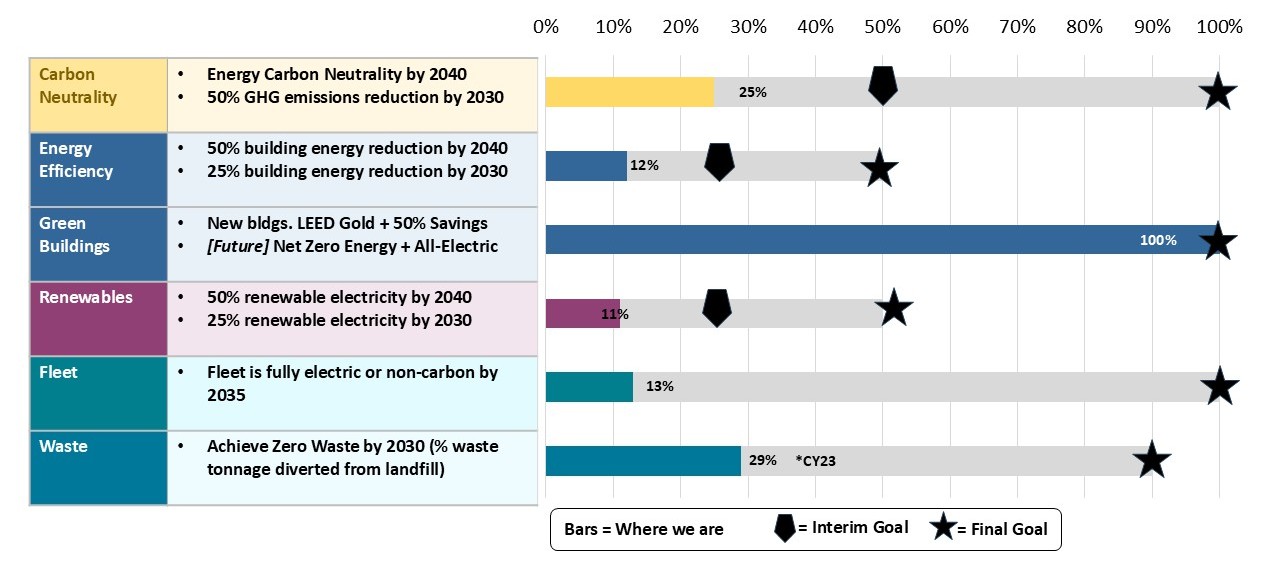
Greenhouse gas emissions, such as carbon dioxide, trap the sun's radiation and warm the Earth's surface - which leads to cascading effects on the climate. To lessen the impacts to human health and the environment, Fairfax County has adopted ambitious climate action goals, including energy carbon neutrality across Fairfax County government operations by 2040 and community-wide carbon neutrality by 2050. The strategies and actions to meet these goals are presented in the Community-wide Energy and Climate Action Plan (CECAP) and the Operational Energy Strategy (OES).  

This page highlights data and metrics for the topic of emissions reductions overall and provides links to additional metrics and details on programs and actions for specific sectors including Buildings, Energy Supply, Transportation, Waste, Natural Resources, and Community Services.

Climate Action Map Viewer

Use the Climate Action Viewer interactive map tool to view actions taken by both the community and county to help address the cause of climate change by reducing emissions and conserving energy across all sectors. The map includes spatial data for actions like green buildings, solar installations, EV charging infrastructure, recycling centers, and tree canopy. 

This map will be updated as data becomes available. Please click this link to see a video explaining how to use this map. (Note: This video references the Resilient Fairfax Map viewer, but the same instructions apply to use the Climate Action Viewer.)

Fairfax County Greenhouse Gas Emissions Inventory and Reduction Goals

The data depicted in the interactive graphic below show the previous greenhouse gas (GHG) inventories conducted by the Metropolitan Washington Council of Governments (MWCOG), sectors that influence Fairfax County’s emission generation, as well as future emissions reduction scenarios to achieve the CECAP goal of carbon neutrality by 2050.

Overall Emissions Reduction Metrics to Track Community Progress (CECAP)

The overall emissions reduction metrics that track the progress in achieving the overall and sector specific goals established in CECAP are presented below. The graphic includes current progress, an estimate of where we should be, interim goal (if applicable) and final goal for each metric.outcomes for CECAP emissions reduction

To view an ADA accessible version of this graphic, click here. 

Overall Emissions Reduction Metrics to Track County Operations Progress (OES)

The overall emissions reduction metrics that track progress in achieving the goals and targets established by the county’s Operational Energy Strategy (OES) are presented below. The graphic includes current progress, an estimate of where we should be, interim goal (if applicable) and final goal for each metric.

OES outcomes progress bars graphics.png

To view an ADA accessible version of this graphic, click here. 

Sector-Specific Metrics

On the following pages, you’ll find emission reduction and resiliency metrics related to specific sectors: Buildings, Energy Supply, Transportation, Waste, Natural Resources, and Community Services.

Fairfax Virtual Assistant